

The Australian Department of Health and Aged Care updates its National Health Workforce Dataset (NHWDS) annually with demographic and employment information on registered health professionals. The NHWDS integrates registration data from the Australian Health Practitioner Regulation Agency (AHPRA) and the national boards, along with data from a workforce survey that health professionals voluntarily complete during registration.
The Medical 2023 National Health Workforce Dataset (NHWDS) was recently published and can be accessed online via the summary statistics tables, the Medical Practitioner dashboard, or the Health Workforce Data Tool. Below we summarise key insights from this data release.
KEY FINDINGS FROM THE MEDICAL 2023 NHWDS:
Key Finding 1: More Specialists in the Australian workforce, but Specialists-in-training and GP numbers have dropped.
2023 saw an increase of +4,730 registered and employed Specialists in the national workforce compared to 2022. This is in line with a continuous growth trend over the decade. However, the number of specialists-in-training reduced by -1,496 in 2023 compared to 2022, marking a reversal of prior steady growth. There was a significant decline of -5,327 registered GPs in the workforce, marking the largest single-year decrease within the 2013-2023 period.
Table 1. Medical Practitioners, Registered and Employed in Australia 2013 to 2023

Table 1 notes: generated using the Health Workforce Data Tool > Professions and Job Area by Year by Workforce Status and Job Role > Filters: Workforce Status: Employed in Australia working in registered profession, Job Role: Clinician; Default Summation: Number of Practitioners, also see Summary Statistics (Medical Profession).
Key Finding 2: Demographics and Work Hours: The average age of Australian medical practitioners is 45.4 years, with an average total working hours of 40.8 per week, demonstrating a relatively experienced and actively working workforce.
Table 2. Medical Practitioners, Registered and Employed in Australia, 2023
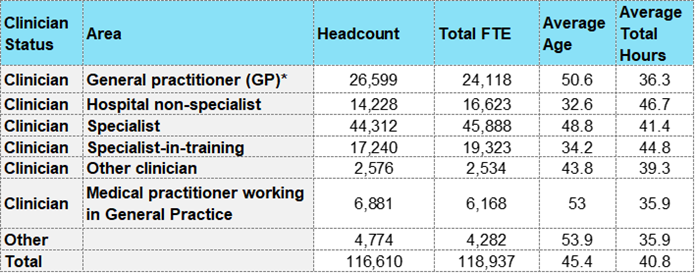
Table 2. notes: Reprinted from Summary Statistics (Medical Profession), updated 22 Apr 2024.*General Practitioners refer to General practitioners using the NHWDS as defined in the method papers under Main job area : General practitioners in Australia: Headcount & workload methods - Summary
Key Finding 3: More indigenous Medical Practitioners. The number of Medical Practitioners who are Indigenous (and Australian born) continues to increase.
Table 3. Medical Practitioners, Indigenous and Australian born, 2013-2023

Table 3. notes: generated using the Health Workforce Data Tool > Professions (Medical Practitioner) and Australian Born Indigenous by Year > No Filters > Default Summation : Number of Practitioners.
The proportion (%) of medical practitioners born in Australia, and qualified in Australia, is decreasing. The proportion of Medical Practitioners initially qualified in Australia peaked at 65.8% in 2021 (during the COVID-19 pandemic), but by 2023 it decreased to 64.26%, indicating a recent downward trend towards pre-2015 levels. The proportion of Medical Practitioners born in Australia is also trending downwards. Refer to Chart 1 and 2 below.
Chart 1. Proportion (%) of Registered and Employed Medical Practitioners with Initial Medical Qualification from Australia, 2013-2023
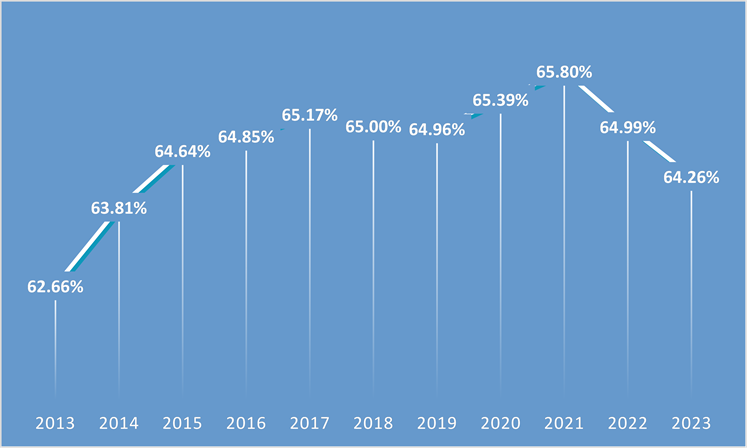
Chart 1 notes: generated by MedicalJobsAustralia using the Health Workforce Data Tool > Professions (Medical Practitioner) and Initial Country of Qualification by Year by Workforce Status > Filters- Workforce Status : In labour force in Australia; Default Summation : Number of Practitioners, percentage. Chart showing results for Medical Practitioners with Initial Country of Qualification-Australia.
Chart 2. Proportion (%) of Medical Practitioners Born in Australia, 2017-2023
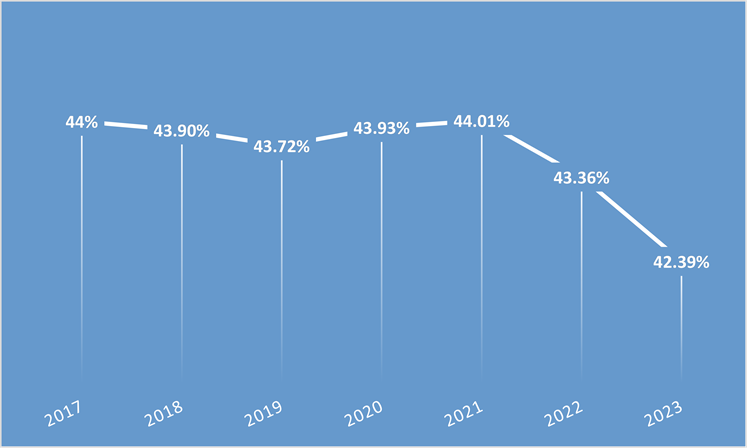
Chart 2 notes: generated by MedicalJobsAustralia using the Medical Practitioner dashboard > Medical Practitioners, all fields, ‘Born in Australia’ metric. To note: data only available from 2017.
Key Finding 4: Labour force participation and Workforce Status: 2023 saw the highest rate (%) of Medical Practitioners 'not working in the Australian labour force' since 2016.
However, the proportion of Medical Practitioners currently working in the Australian labour market is stable – 2023 levels sit at 2018 levels, after a slight increase during the 2020-2021 pandemic years.
Table 4. Australian Medical Practitioners by Workforce Status, 2016-2023

Table 4. notes: generated using the Health Workforce Data Tool > Professions (Medical Practitioner) and Workforce Status by Year > No Filters > Default Summation : Number of Practitioners.


