

MedicalJobsAustralia.com’s recent Health Care Workforce Trends Report for October 2023 investigated Australian Health Practitioner Regulation Agency (AHPRA) registration numbers over the last 5 years. It indicates steady growth in registration numbers for most health and medical professions between June 2018 and June 2023, which is good news.
Below, we conduct further analysis of this trend by calculating a Full-time Equivalent (FTE) estimate of AHPRA registration numbers, for each professional category. We then calculate the ratio of FTE AHPRA Registered professionals in the Australian population, which has also seen substantial growth over the last five years. We found there were 4.63 FTE AHPRA Registered Medical Practitioners per 1000 people in Australia. Please see our charts below for a further breakdown of this information, including our analysis methods and sources.
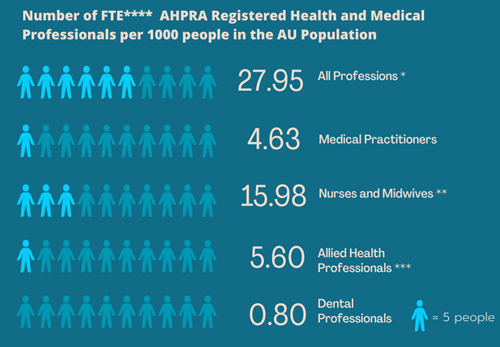
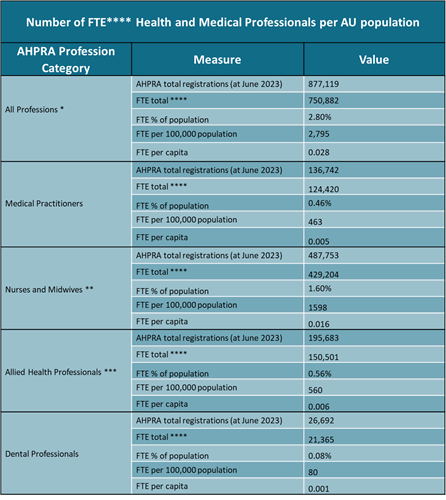
Chart Notes: The above charts were generated by MedicalJobsAustralia.com using AHPRA registration data, the Health Workforce Data Tool (for FTE % rate), and ABS population data. Please see our data sources and methods below.
* The ‘All Professions’ category includes AHPRA registration numbers for occupations that are regulated by AHPRA but not listed in our analysis, such as Paramedics.
**The ‘Nurses and Midwives’ category includes all standalone and dual Nurse and Midwife AHPRA registration numbers combined.
***The ‘Allied Health Professionals’ category includes registrations from 9 of the AHPRA national health boards: Physiotherapy, Occupational Therapy, Psychology, Optometry, Pharmacy, Osteopathy, Podiatry, Chiropractic, and Medical Radiation Practice. (Please note: our analysis of Allied Health registrations does not cover all AHPRA health boards, such as the Board of Paramedicine, and does not include self-regulating Allied Health Professions, e.g., those which are not AHPRA regulated, such as Dietitians, or Audiologists).
****FTE total was calculated using the Health Workforce Data Tool (2021 data – please see further information regarding our data sources and methods below).
Data Sources:
The Australian Health Practitioner Regulation Agency (AHPRA) Registration Data:
- Data for ‘All Professions’, ‘Medical Practitioners’, and ‘Nurses and Midwives’ can be found on the AHPRA website here.
- Data for ‘Dental Professionals’ can be found here. Please go to Registrant Data> Registration Data Table for June 2023 (Table 1.1 Registration type and subtype by principal place of practice - Total value)
- Data for ‘Allied Health Professionals’ can be found by downloading the Registration Data Tables (Table 1.1 Registration type and subtype by principal place of practice - Total value) for June 2023 from the following national Health Boards:
Data values from each board above were combined to form total registration numbers for our ‘Allied Health Professionals’ category.
FTE Statistics:
- Data for the FTE total can be found here: Health Workforce Data Tool – The Department of Health and Aged Care provides this data tool (you need to register). We created a table using Professions by Summation Options (Profession type and Year 2021 – the latest complete data set). Counting: Number of Practitioners, and FTE Total. We then calculated the FTE % rate and applied it to AHPRA registration numbers (from June 2023) to estimate the number of AHPRA Registered FTE professionals in the workforce to compare to AU population numbers.
ABS Population Statistics:
- Data for Australian population numbers can be found here.
- The population figure used in this report is 26,861,043, which was the Population Clock (Estimated Resident Population (ERP) reading taken on October 2023). Note: Australia’s population was 26,473,055 people when measured on 31 March 2023.
Methods and Limitations:
- We recorded total AHPRA registration numbers for June 2023 for the following professional categories – Medical Practitioners, Nurses and Midwives (combined Nurse and Midwife registrations), Dental Professionals, and Allied Health Professionals (we combined Physiotherapy, Occupational Therapy, Psychology, Optometry, Pharmacy, Osteopathy, Podiatry, Chiropractic and Medical Radiation registrations). Limitations: Allied Health data may not be representative of individual Allied health professions and does not include all Allied Health professions. Quarterly AHPRA registration numbers may be affected by seasonal fluctuations.
- As AHPRA registration figures do not differentiate between full-time and part-time work, we wanted to calculate the Full Time Equivalent for each professional category. We created a table using the Health Workforce Data Tool which gave us the following data from 2021: Total number of practitioners (for each category) and the FTE total. We calculated the FTE % rate for each category by dividing the FTE total by the total number of practitioners and multiplying this by 100. Limitations: FTE data is from 2021 (the latest complete dataset), so the % rate may not reflect the current 2023 FTE % rate.
- For each category, we applied the FTE % rate to the latest AHPRA registration numbers (June 2023) to work out the number of FTE professionals currently registered and in the workforce. Limitations: As above.
- We compared the FTE total for each professional category to the Australian population by:
- Calculating FTE % of population (FTE total / total Au population (26,861,043) x 100).
- Calculating the FTE per 100,000 of the population (FTE % x 100,000)
- Calculating the FTE per capita (FTE total / total au population (26,861,043))


