

Our analysis looks at the latest ABS data that estimates employee earnings and hours, pay settings, and public vs private sector wages and distribution – available by industry and occupation category.
ABS data releases used in this report:
- Employee Earnings and Hours, Australia (latest reference period May 2023). This release uses estimates from the 2023 Survey of Employee Earnings and Hours (EEH). We look at Employee Earnings and Hours data by occupation group (ANZSCO4, ANZSCO3, and major group categories) and by industry (ANZSIC, the Health Care and Social Assistance Industry). The survey is conducted on a biennial basis and covers most employing organisations in Australia (public and private sectors). The minimum response target is 90%. Note that self-employed persons such as subcontractors, owners or consultants may not fall into the scope of the survey. More information on ABS methodology can be found here.
- Labour Force Australia, detailed (latest release, reference period November 2023). This release includes quarterly statistics by Industry, Occupation and Sector, in particular, Employed persons by Sector (public/private).
- ‘Public sector employment and earnings’ (reference period 2022-23 FY). This estimate is released annually, referencing each financial year. Public sector employee earnings are available by Industry (ANZSIC classification).
- ‘Business Indicators, Australia’ (reference period September 2023) is released quarterly and provides estimates of private sector wages and salaries by Industry (ANZSIC classification).
SUMMARY OF FINDINGS:
Average weekly earnings are continuing to grow at a strong level: the average weekly earnings of all employees in the Health Care and Social Assistance Industry grew by 6.37% between May 2021 - May 2023 (about 3.19% p/year). This compares to 9.43% growth between May 2018 - May 2021 (about 3.14% p/year), while between May 2016 - May 2018 there was a -0.74% decline in average weekly earnings (about -0.37% p/year). The rate of growth has been declining since the pandemic peak, however, it remains far higher than in recent pre-pandemic years, when negative growth in average weekly earnings was recorded.
Chart 1. Health care and social assistance industry: All employees - average weekly total cash earnings
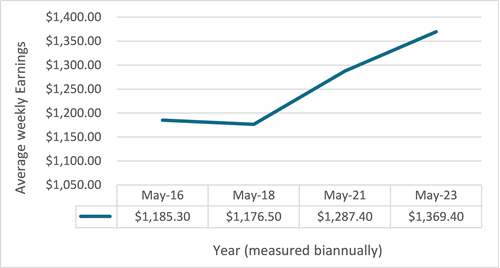
Chart 1. Source: Employee Earnings and Hours, Australia, May-23; Employee Earnings and Hours, May-21; Employee Earnings and Hours, May-2018; Archived release Employee Earnings and Hours, Australia, May 2016 > All employees, average weekly total cash earnings – industry > Health care and social assistance industry.
General Practitioners, Resident Medical Officers, and Specialist Physicians are earning less weekly compared to the pandemic peak: in May-23, General Practitioners, Resident Medical Officers, and Specialist Physicians had lower average weekly cash earnings compared to May-21, probably due to less demanding hours of work compared to the pandemic years. On the other hand, Surgeons, Anaesthetists and ‘Other Medical Practitioners (not further defined)’ recorded higher average weekly earnings in May-23 compared to May-21, however earnings still remain lower than May 2018, which saw a peak in earnings for these occupations. This is possibly due to an increase in part-time working arrangements since 2018.
Chart 2. Medical Practitioners: All employees > Average weekly total cash earnings, by detailed occupation
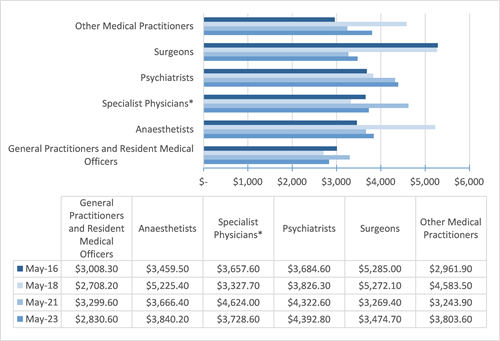
Chart 2. Source: Employee Earnings and Hours, Australia, May-23; Employee Earnings and Hours, May-21; Employee Earnings and Hours, May-2018; Archived release Employee Earnings and Hours, Australia, May 2016 > Data cube 11. All employees > Average weekly total cash earnings, average age - sex: by detailed occupation (ANZSCO 4 digit). *Note: this does not indicate differences between hours worked (e.g. full-time vs part-time hours), or pay rates (e.g. adults rate vs junior rate).
Average hourly total cash earnings show mixed growth across occupation groups, but average hours worked remains steady: average hourly total cash earnings for full-time non-managerial employees paid at the adult rate, are lower in May-23 for Medical Practitioners, but higher for Midwives and Nurses, and Allied Health Professionals, however this does not differentiate between individual occupations within these occupation groups. Average full-time hours worked for full-time non-managerial employees paid at the adult rate have increased slightly for Medical Practitioners (41.3 hours in May-23 vs 40.3 hours in May-21), but remain steady for Midwifes and Nurses, and Allied Health Professionals, at 38 hrs per week.
Table 1. Full-time non-managerial employees paid at the adult rate: Average weekly total cash earnings, average weekly total hours paid for, average hourly total cash earnings, by occupation group.
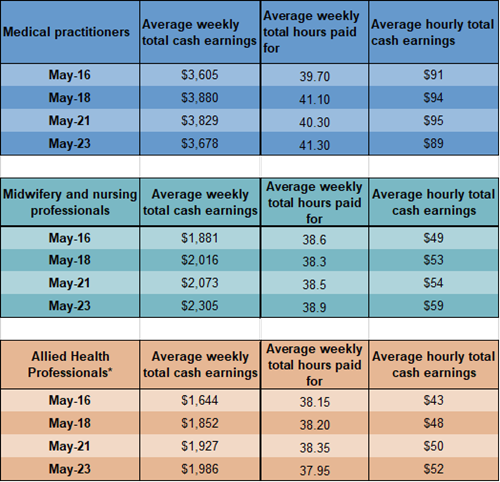
Chart 3. Hourly Earnings over time for Full-time non-managerial employees paid at the adult rate, by occupation group
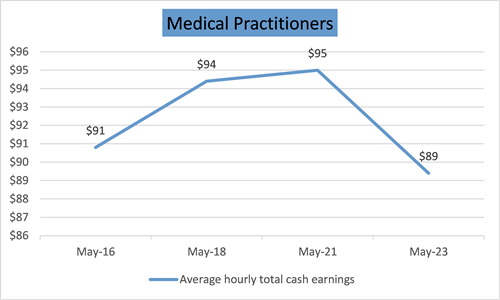
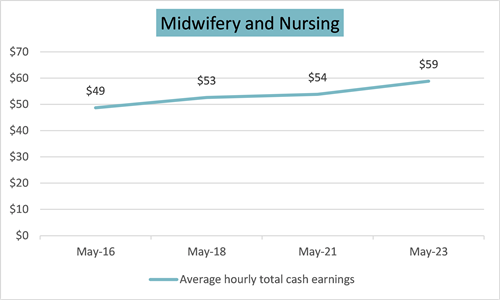
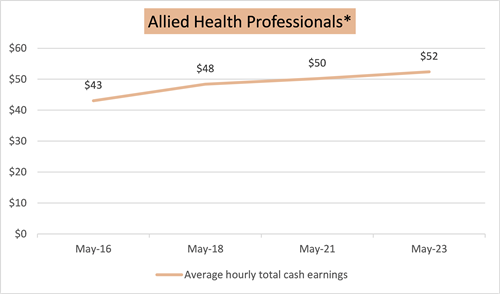
Table 1. and Chart 3. above, source: Employee Earnings and Hours, Australia, May-23; Employee Earnings and Hours, May-21; Employee Earnings and Hours, May-2018; Archived release Employee Earnings and Hours, Australia, May 2016 > Data cube 14. Full-time non-managerial employees paid at the adult rate > Average weekly ordinary time and total cash earnings, average weekly ordinary time and total hours paid for, average hourly ordinary time and total cash earnings - method of setting pay: by detailed occupation (ANZSCO 3 digit).
Pay-setting distribution in the health care and social assistance industry: 47% of employees in the Health Care and social assistance sector are paid under Collective Agreements, followed by 34% under Award settings. However, this distribution is for the industry overall and does not reflect the distribution of pay-settings within specific occupation groups (refer to chart 4. Below).
Analysis of Pay Settings in the Health care and Social Assistance Industry: compared to the average rate of pay across all pay settings, Collective Agreements yielded higher pay for Specialist Physicians and Anaesthetists, while owner/manager General Practitioners earned around 33.49% higher than the average. Surgeons on Collective Agreements earned 19.26% lower than the average across all pay settings. Allied Health professionals had mixed results, with Occupational and environmental health professionals, Dental practitioners, Audiologists and speech pathologists, Physiotherapists, Social workers, and Medical Scientists on Individual Agreements earning more on average than those on Collective Agreements, however the opposite was true for Pharmacists, Health and welfare services managers, and Psychologists, who earned more under Collective Agreements. Owner/manager Physiotherapists earned the least compared to the other pay settings, although this may be due to this cohort having a better work-lift balance and working reduced hours. Owner/manager Psychologists earned 33.04% higher than the average across all pay settings (refer to Table 2. below).
Chart 4. Distribution of all employees in the Health care and social assistance industry, by pay-setting, May-23
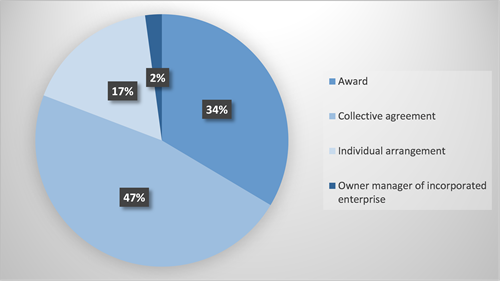
Chart 4. Source: https://www.abs.gov.au/statistics/labour/earnings-and-working-conditions/employee-earnings-and-hours-australia/latest-release > Data cube 2. All employees > Number of employees, average weekly total cash earnings, average age - method of setting pay.
Table 2. Average weekly total cash earnings, Occupation, by pay setting, May-23
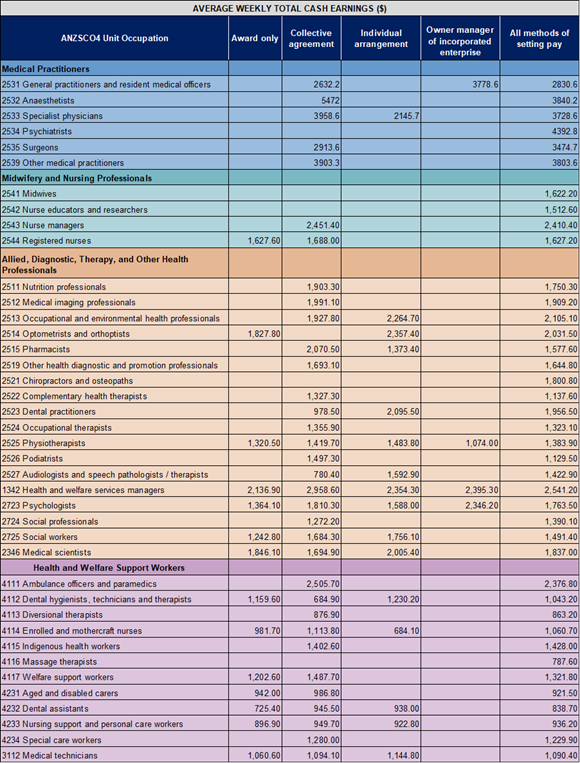
Table 2. Source: https://www.abs.gov.au/statistics/labour/earnings-and-working-conditions/employee-earnings-and-hours-australia/latest-release#data-downloads > Data cube 12. All employees > Average weekly total cash earnings, average age - method of setting pay: by detailed occupation (ANZSCO 4 digit). Note: blank cells indicate no data available for publication or no employee earnings in that pay-setting.
The private sector employs the majority of employees in the health care and social assistance industry, with a higher proportion employed part-time.
Chart 5. Distribution of all employees in Health care and social assistance industry, by sector (public vs private)
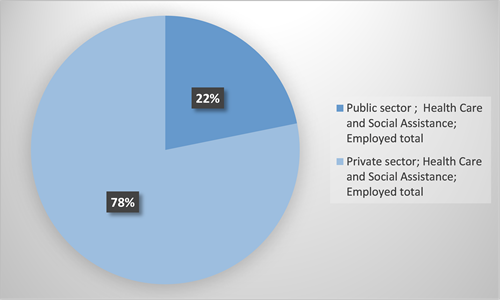
Chart 5. Source: https://www.abs.gov.au/statistics/labour/employment-and-unemployment/labour-force-australia-detailed/latest-release > Industry, Occupation and Sector Quarterly (November-23) > Table 27. Employed persons by Sector (public/private) and Industry division (ANZSIC) of main job.
Chart 6. Health care and social assistance industry: Public sector employees by full-time vs part-time employment; Private sector employees by full-time vs part-time employment
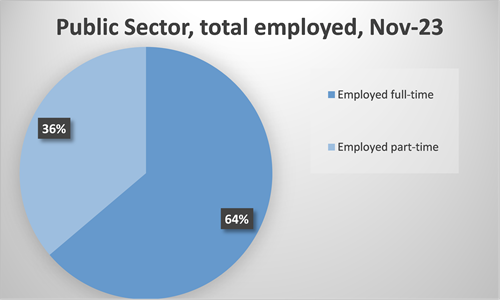
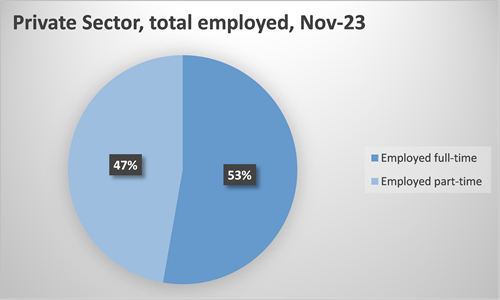
Chart 6. Source: https://www.abs.gov.au/statistics/labour/employment-and-unemployment/labour-force-australia-detailed/latest-release > Industry, Occupation and Sector Quarterly (November-23) > Table 27. Employed persons by Sector (public/private) and Industry division (ANZSIC) of main job.
Wages and salaries data show strong year-on-year growth for the health care and social assistance industry in both the public and private sectors.
Public sector cash wages and salaries in the health care and social assistance industry grew by 8.93% year-on-year (2021/22 FY vs 2022/23 FY), while private sector seasonally adjusted wages grew 8.01% year-on-year (Jun-22 vs Jun-23), and by 12.27% year-on-year between Sept-22 and Sept-23. The tables below give an indication of annual average growth rates for total wages paid between 2017-2023, revealing different growth trends pre-pandemic, during the pandemic years, and currently. The private sector had strong wage growth prior to the pandemic years, while the public sector is showing above-average annual growth in the latest financial year period.
To note: making direct comparisons between private sector vs public sector total wages paid in the health care and social assistance industry is problematic using ABS data as the metrics and reference periods are different and do not differentiate between number of employees, part-time/full-time hours, or pay settings. Rather than indicating growth in individual employee earnings, these metrics reflect growth in overall wages paid by employers for each sector (public/private), which may encompass pay increases or expanding workforce numbers.
Table 3. Public sector Cash wages and salaries over time

Table 3. Source: Employment and Earnings, Public Sector, Australia, 2022-23 FY; Employment and Earnings, Public Sector, Australia, 2021-22 FY; Employment and Earnings, Public Sector, Australia, 2019-20 FY; Employment and Earnings, Public Sector, Australia, 2018-19 FY; > Public sector employees and cash wages and salaries, industry.
Table 4. Private sector seasonally adjusted wages and salaries, Health care and social assistance industry
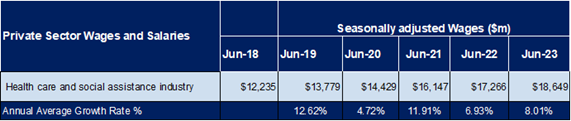
Table 4. Source: Business Indicators, Australia, Sep-23; Business Indicators, Australia, Jun-22; Business Indicators, Australia, Jun-21 > Analysis by industry > Wages and salaries > Health care and social assistance, Current prices.
Notes on ABS Data, including industry and occupation classifications:
Our analysis uses the latest ABS data releases available at the time of writing, and we provide links to our sources. You can refer to the source links and ABS methodology to properly interpret the data presented.
The ABS publishes a range of statistical releases with some data available by industry or occupation. Our analysis looks at industry-specific ABS data relating to the ‘Health Care and Social Assistance’ Industry. More information about the Australian and New Zealand Standard Industrial Classification (ANZSIC) can be found here.
Our analysis also looks at ABS occupation-specific data that relates to the medical and health workforce in Australia. More information on the Australian and New Zealand Standard Classification of Occupations (ANZSCO) can be found here.


