As of August 2024, most states saw health sector internet job vacancies decline compared to 2023, but vacancy rates varied across Australian states and territories. Vacancy rates were higher than the national average in TAS, ACT, NT, and QLD. TAS had the highest vacancy rate for medical practitioners, considerably higher than the national average, followed by NSW. Allied Health positions were in demand in NT, while SA had above average vacancies for Nursing and Midwifery professionals. Below we break-down the data state by state to show health and medical online job vacancies and vacancy rates for each Australian sate and territory.
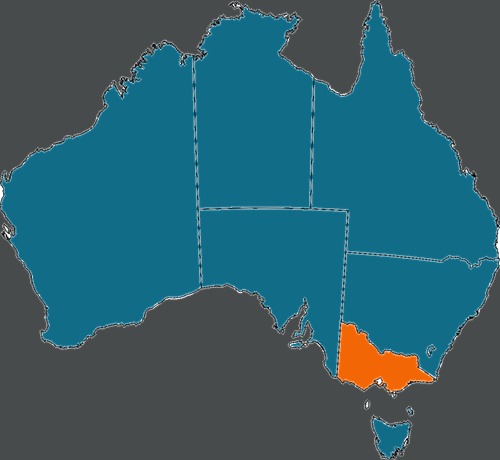
Victoria:
|
Occupation Group* |
Job Vacancies, Aug-24 |
M-o-m change |
Y-o-y change |
|
WHOLE SECTOR |
7,913 |
-4.18% |
-31.82% |
|
Technicians/Assistants/Support |
2,129 |
-4.34% |
-28.43% |
|
Allied Health |
2,624 |
-1.80% |
-27.76% |
|
Nursing and Midwifery |
1,911 |
-8.39% |
-42.27% |
|
Medical Practitioners |
1,082 |
-1.70% |
-24.32% |
|
Vacancy Rates, Aug-24 (online job vacancies as % of total employed) |
VIC |
AUSTRALIA |
|
WHOLE SECTOR |
1.78% |
1.90% |
|
Technicians/Assistants/Support |
0.49% |
1.35% |
|
Allied Health |
2.12% |
2.53% |
|
Nursing and Midwifery |
1.92% |
2.05% |
|
Medical Practitioners |
2.14% |
3.12% |
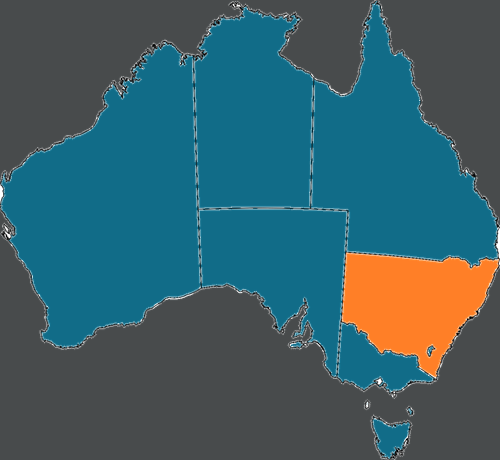
New South Wales:
|
Occupation Group* |
Job Vacancies, Aug-24 |
M-o-m change |
Y-o-y change |
|
WHOLE SECTOR |
9,148 |
-0.74% |
-28.75% |
|
Technicians/Assistants/Support |
2,713 |
-2.71% |
-25.48% |
|
Allied Health |
2,803 |
1.71% |
-25.05% |
|
Nursing and Midwifery |
2,066 |
-4.09% |
-39.63% |
|
Medical Practitioners |
1,359 |
5.51% |
-22.18% |
|
Vacancy Rates, Aug-24 (online job vacancies as % of total employed) |
NSW |
AUSTRALIA |
|
WHOLE SECTOR |
1.83% |
1.90% |
|
Technicians/Assistants/Support |
1.24% |
1.35% |
|
Allied Health |
2.62% |
2.53% |
|
Nursing and Midwifery |
1.75% |
2.05% |
|
Medical Practitioners |
4.59% |
3.12% |
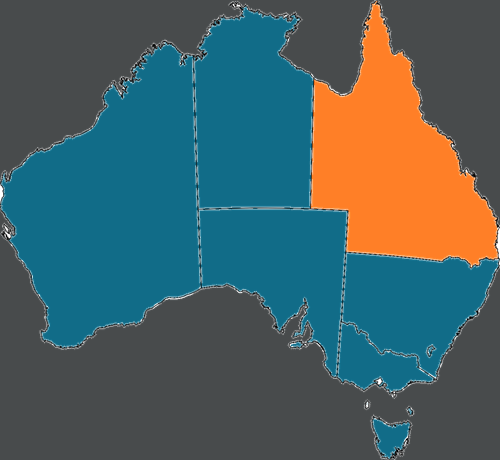
Queensland:
|
Occupation Group* |
Job Vacancies, Aug-24 |
M-o-m change |
Y-o-y change |
|
WHOLE SECTOR |
7706 |
0.22% |
-15.54% |
|
Technicians/Assistants/Support |
2279 |
0.35% |
-7.87% |
|
Allied Health |
2437 |
0.62% |
-7.22% |
|
Nursing and Midwifery |
1703 |
-0.72% |
-17.67% |
|
Medical Practitioners |
1085 |
2.01% |
-37.60% |
|
Vacancy Rates, Aug-24 (online job vacancies as % of total employed) |
QLD |
AUSTRALIA |
|
WHOLE SECTOR |
2.40% |
1.90% |
|
Technicians/Assistants/Support |
1.80% |
1.35% |
|
Allied Health |
2.96% |
2.53% |
|
Nursing and Midwifery |
2.36% |
2.05% |
|
Medical Practitioners |
4.41% |
3.12% |
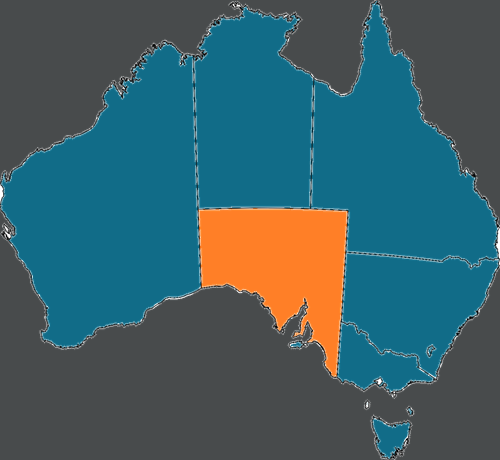
South Australia:
|
Occupation Group* |
Job Vacancies, Aug-24 |
M-o-m change |
Y-o-y change |
|
WHOLE SECTOR |
2,541 |
-2.95% |
-5.32% |
|
Technicians/Assistants/Support |
720 |
-6.82% |
-3.70% |
|
Allied Health |
700 |
3.55% |
-6.54% |
|
Nursing and Midwifery |
817 |
-4.55% |
6.06% |
|
Medical Practitioners |
258 |
-2.15% |
-28.37% |
|
Vacancy Rates, Aug-24 (online job vacancies as % of total employed) |
SA |
AUSTRALIA |
|
WHOLE SECTOR |
1.93% |
1.90% |
|
Technicians/Assistants/Support |
1.26% |
1.35% |
|
Allied Health |
2.44% |
2.53% |
|
Nursing and Midwifery |
2.98% |
2.05% |
|
Medical Practitioners |
2.44% |
3.12% |
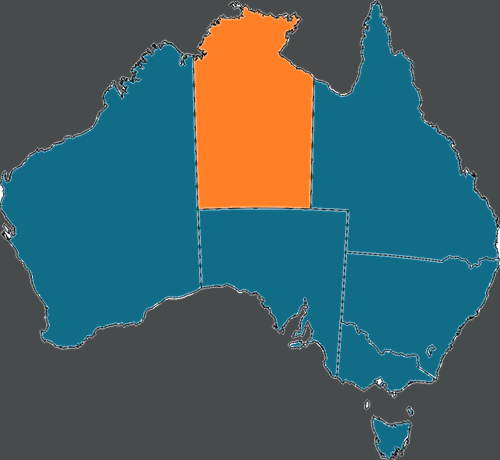
Northern Territory:
|
Occupation Group* |
Job Vacancies, Aug-24 |
M-o-m change |
Y-o-y change |
|
WHOLE SECTOR |
638 |
0.16% |
-9.11% |
|
Technicians/Assistants/Support |
151 |
-9.58% |
2.95% |
|
Allied Health |
249 |
5.06% |
-0.13% |
|
Nursing and Midwifery |
149 |
-2.83% |
-25.87% |
|
Medical Practitioners |
69 |
13.81% |
-17.27% |
|
Vacancy Rates, Aug-24 (online job vacancies as % of total employed) |
NT |
AUSTRALIA |
|
WHOLE SECTOR |
2.89% |
1.90% |
|
Technicians/Assistants/Support |
1.72% |
1.35% |
|
Allied Health |
6.38% |
2.53% |
|
Nursing and Midwifery |
2.44% |
2.05% |
|
Medical Practitioners |
3.81% |
3.12% |
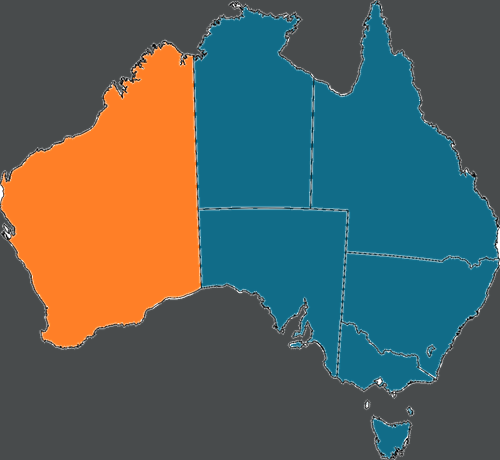
Western Australia:
|
Occupation Group* |
Job Vacancies, Aug-24 |
M-o-m change |
Y-o-y change |
|
WHOLE SECTOR |
2,962 |
-3.10% |
-25.32% |
|
Technicians/Assistants/Support |
797 |
-2.25% |
-17.15% |
|
Allied Health |
1,081 |
-2.50% |
-16.03% |
|
Nursing and Midwifery |
659 |
-5.77% |
-35.24% |
|
Medical Practitioners |
340 |
0.29% |
-41.95% |
|
Vacancy Rates (online job vacancies as % of total employed) |
WA |
AUSTRALIA |
|
WHOLE SECTOR |
1.53% |
1.90% |
|
Technicians/Assistants/Support |
0.98% |
1.35% |
|
Allied Health |
2.60% |
2.53% |
|
Nursing and Midwifery |
1.64% |
2.05% |
|
Medical Practitioners |
1.51% |
3.12% |
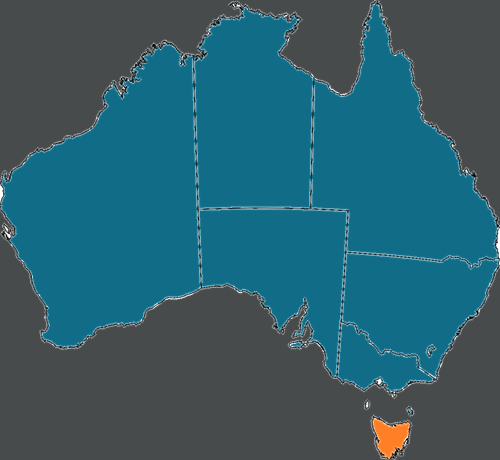
Tasmania:
|
Occupation Group* |
Job Vacancies, Aug-24** |
M-o-m change |
Y-o-y change |
|
WHOLE SECTOR |
963 |
-9.97% |
-13.11% |
|
Technicians/Assistants/Support |
222 |
-11.55% |
2.30% |
|
Allied Health |
227 |
-5.82% |
-23.77% |
|
Nursing and Midwifery |
252 |
-17.11% |
-22.14% |
|
Medical Practitioners |
242 |
-4.86% |
-2.03% |
|
Vacancy Rates, Aug-24 (online job vacancies as % of total employed) |
TAS |
AUSTRALIA |
|
WHOLE SECTOR |
2.49% |
1.90% |
|
Technicians/Assistants/Support |
1.23% |
1.35% |
|
Allied Health |
4.05% |
2.53% |
|
Nursing and Midwifery |
2.60% |
2.05% |
|
Medical Practitioners |
7.80% |
3.12% |
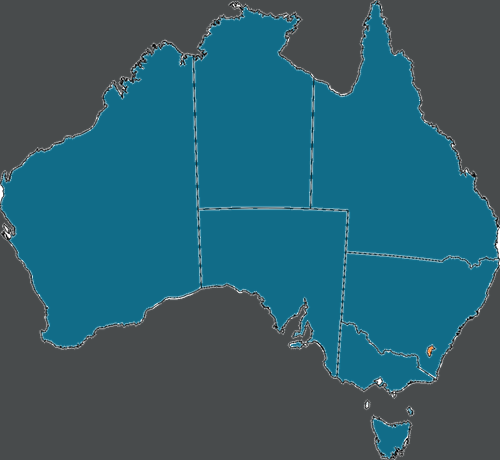
Australian Capital Territory:
|
Occupation Group* |
Job Vacancies, Aug-24 |
M-o-m change |
Y-o-y change |
|
WHOLE SECTOR |
834 |
1.30% |
-19.86% |
|
Technicians/Assistants/Support |
185 |
-1.77% |
-0.36% |
|
Allied Health |
288 |
1.41% |
-17.07% |
|
Nursing and Midwifery |
208 |
0.16% |
-28.16% |
|
Medical Practitioners |
130 |
-57.33% |
-29.22% |
|
Vacancy Rates, Aug-24 (online job vacancies as % of total employed) |
ACT |
AUSTRALIA |
|
WHOLE SECTOR |
2.73% |
1.90% |
|
Technicians/Assistants/Support |
1.69% |
1.35% |
|
Allied Health |
3.68% |
2.53% |
|
Nursing and Midwifery |
3.63% |
2.05% |
|
Medical Practitioners |
3.72% |
3.12% |
Australia:
|
Occupation Group* |
Job Vacancies, Aug-24 |
M-o-m change |
Y-o-y change |
|
WHOLE SECTOR |
32384 |
-1.97% |
-24.12% |
|
Technicians/Assistants/Support |
530 |
-5.86% |
-25.40% |
|
Allied Health |
10461 |
-0.02% |
-19.50% |
|
Nursing and Midwifery |
7766 |
-5.02% |
-31.91% |
|
Medical Practitioners |
4565 |
1.62% |
-28.39% |
|
Vacancy Rates, August-24 (online job vacancies as % of total employed) |
AUSTRALIA |
|
WHOLE SECTOR |
1.90% |
|
Technicians/Assistants/Support |
1.35% |
|
Allied Health |
2.53% |
|
Nursing and Midwifery |
2.05% |
|
Medical Practitioners |
3.12% |
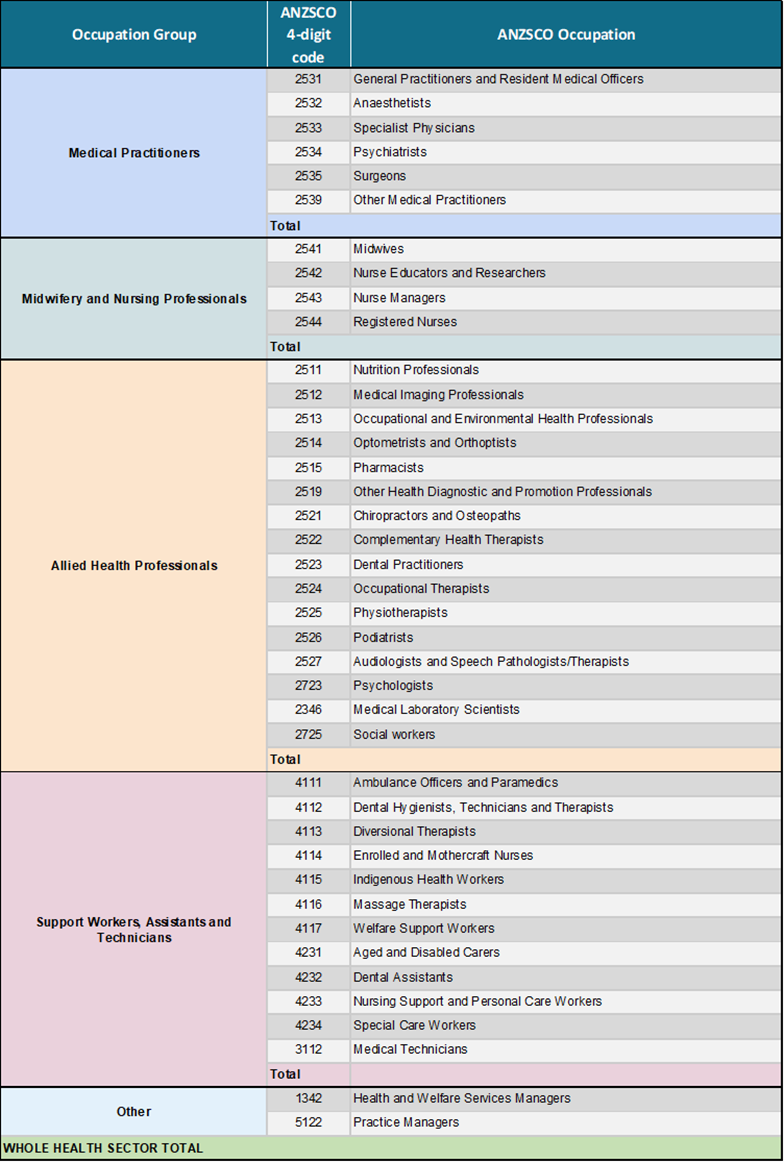
Notes and sources: *Refer to the ANZSCO Occupation Table below for the health and medical occupations and Occupation Groups covered in this report. Job Vacancies data - https://www.jobsandskills.gov.au/data/internet-vacancy-index > Data downloads > Internet Vacancies, ANZSCO4 Occupations, States and Territories - August 2024.xlsx; Total Employed data - https://www.abs.gov.au/statistics/labour/employment-and-unemployment/labour-force-australia-detailed/latest-release#data-downloads > EQ08 - Employed persons by Occupation unit group of main job (ANZSCO), Sex, State and Territory> August-24.
ANZSCO 'Health and Medical' Occupation Table: