

Australian Health Workforce - Jobs Summary (Aug-24 data):
Overall Health and Medical job vacancies in Australia continue to decline on the back of record employment growth and a weakening economy. Total Employed is at a record high for the sector. Population growth is moderating, and vacancy rates are dropping. However, job vacancies for Medical Practitioners increased slightly month-on-month. Find analysis for each occupation group below.
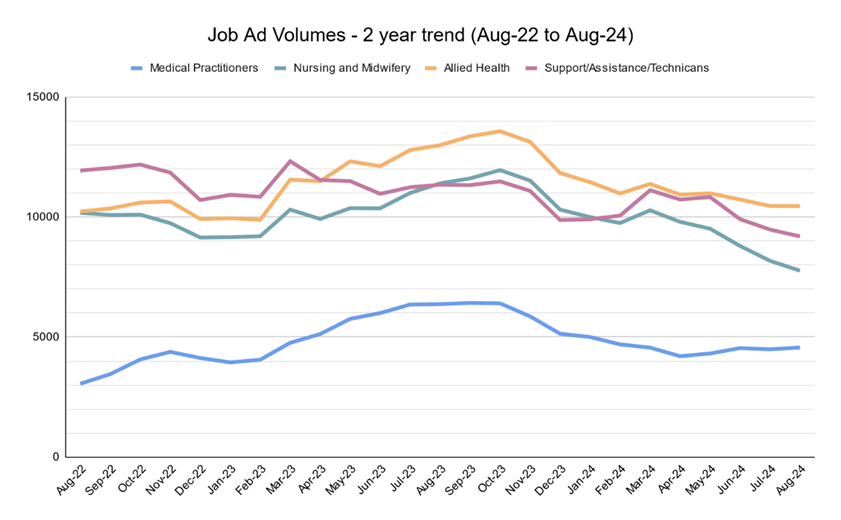
Source: https://www.jobsandskills.gov.au/data/internet-vacancy-index > Data downloads > Internet Vacancies, ANZSCO4 Occupations, States and Territories - August 2024.xlsx. Refer to the ANZSCO Occupation table below for the break-down of Occupations and Occupation Groups covered in the scope of this report.
WHOLE SECTOR/ ALL OCCUPATIONS
Job Vacancies, Aug-24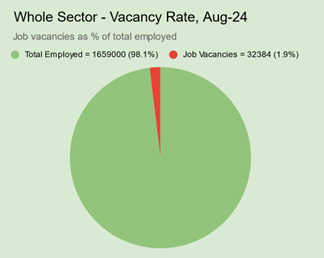
Month-on-month change (Aug-24 vs July-24): ⬇
-652 job vacancies -1.97%
Year-on-year change (Aug-24 vs Aug-23): ⬇
-10294 -24.12%
Job Vacancy Rate, Aug-24
(Job Vacancies as % of Total Employed workforce): 1.9%
10-year Trend: Total Employed vs Job Vacancies
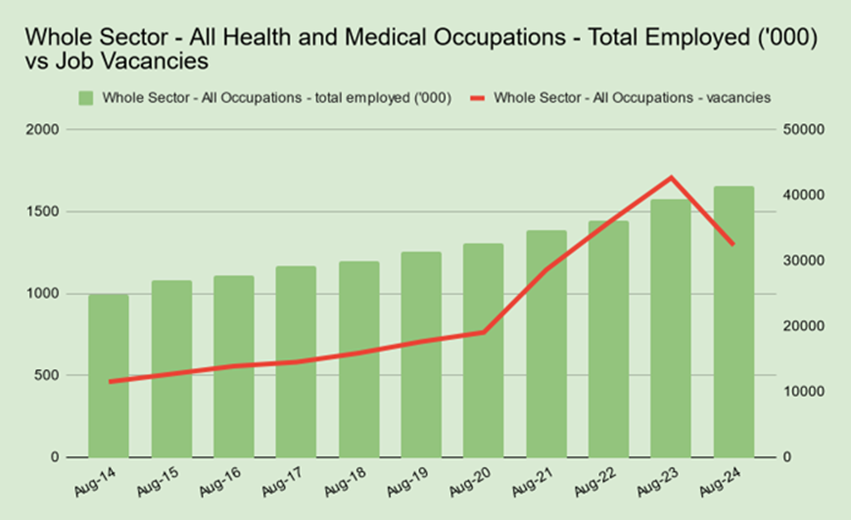
Source: Job Vacancies - https://www.jobsandskills.gov.au/data/internet-vacancy-index > Data downloads > Internet Vacancies, ANZSCO4 Occupations, States and Territories - August 2024.xlsx; Total Employed - https://www.abs.gov.au/statistics/labour/employment-and-unemployment/labour-force-australia-detailed/latest-release#data-downloads > EQ08 - Employed persons by Occupation unit group of main job (ANZSCO), Sex, State and Territory, August 1986 onwards (Pivot Table). Refer the ANZSCO Occupation Table below for the break-down of Occupations and Occupation Groups covered in the scope of this report.
10-year Trend: Total Employed as % of Australian Population
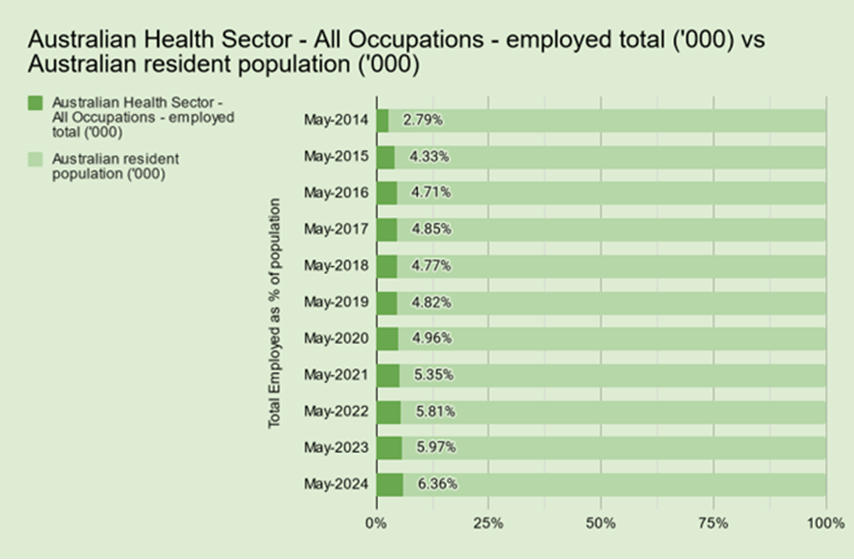
Source: Population data - https://www.abs.gov.au/statistics/people/population/national-state-and-territory-population/mar-2024#data-downloads > Population - states and territories, Quarterly population by sex, by state and territory, from June 1981 onwards > Q1 (March) yearly values. Total Employed data - https://www.abs.gov.au/statistics/labour/employment-and-unemployment/labour-force-australia-detailed/latest-release#data-downloads > EQ08 - Employed persons by Occupation unit group of main job (ANZSCO), Sex, State and Territory, August 1986 onwards (Pivot Table) > Q2 (May) values. Refer to the ANZSCO Occupation Table below for the break-down of Occupations and Occupation Groups covered in the scope of this report.
MEDICAL PRACTITIONERS
Job Vacancies Aug-24
Month-on-month change (Aug-24 vs July-24): ⬆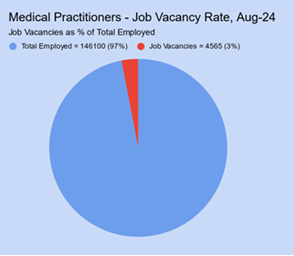
+73 +1.62%
Year-on-year change (Aug-24 vs Aug-23): ⬇
-1810 -28.39%
Job Vacancy Rate, Aug-24
(vacancies as % of total employed workforce): 3%
10-year Trend: Total Employed vs Job Vacancies
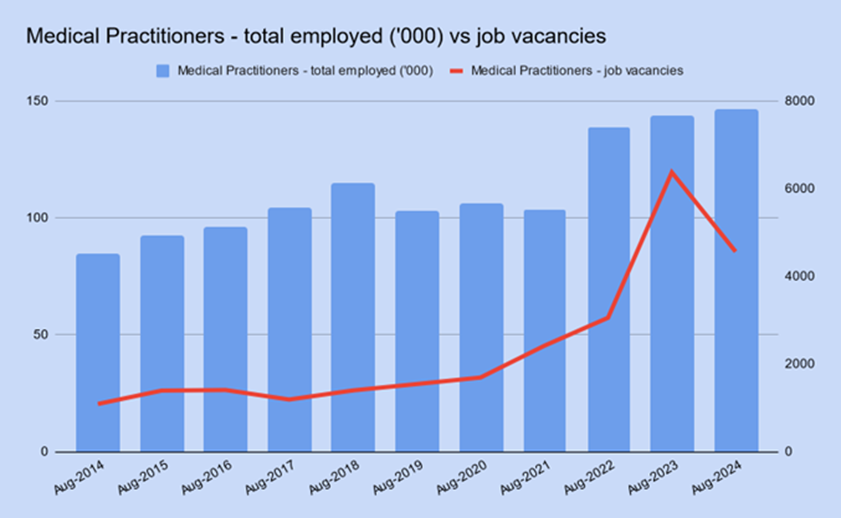
Source: Job Vacancies - https://www.jobsandskills.gov.au/data/internet-vacancy-index > Data downloads > Internet Vacancies, ANZSCO4 Occupations, States and Territories - August 2024.xlsx; Total Employed - https://www.abs.gov.au/statistics/labour/employment-and-unemployment/labour-force-australia-detailed/latest-release#data-downloads > EQ08 - Employed persons by Occupation unit group of main job (ANZSCO), Sex, State and Territory, August 1986 onwards (Pivot Table). Refer to the ANZSCO Occupation Table below for the break-down of Medical Practitioner occupations covered in the scope of this report.
Average # online job ads for August: 3-years compared
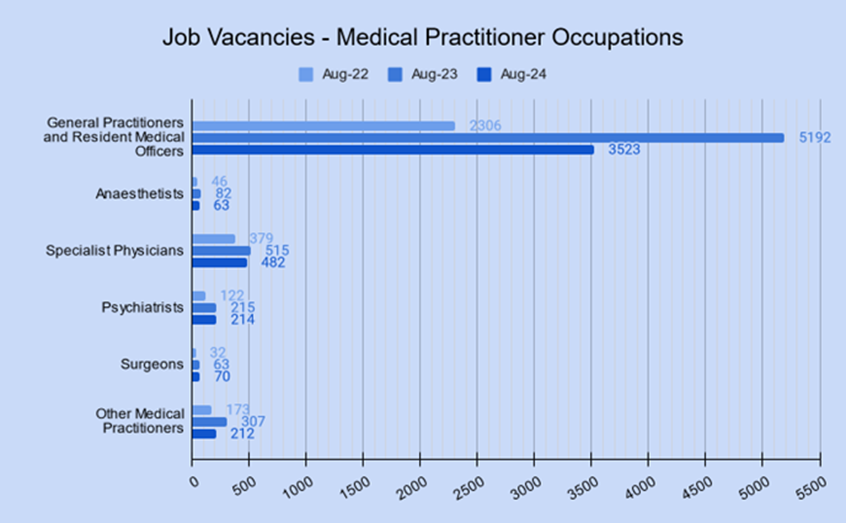
Source: Job Vacancies - https://www.jobsandskills.gov.au/data/internet-vacancy-index > Data downloads > Internet Vacancies, ANZSCO4 Occupations, States and Territories - August 2024.xlsx > Medical Practitioner Occupations (refer to the ANZSCO Occupation Table below for the break-down of Medical Practitioner occupations covered in the scope of this report).
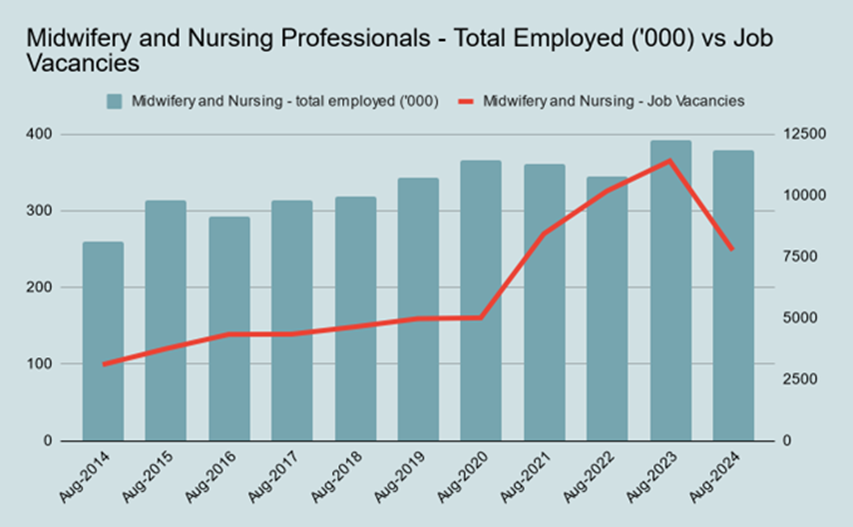
NURSING AND MIDWIFERY
Job Vacancies, Aug-24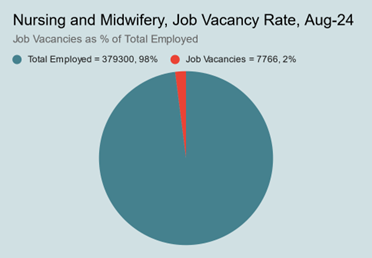
Month-on-month change (Aug-24 vs July-24): ⬇
-411 -5.02%
Year-on-year change (Aug-24 vs Aug-23): ⬇
-3639 -31.91%
Job Vacancy Rate, Aug-24
(Vacancies as % of total employed workforce): 2%
10-year Trend: Total Employed vs Job Vacancies
Source: Job Vacancies - https://www.jobsandskills.gov.au/data/internet-vacancy-index > Data downloads > Internet Vacancies, ANZSCO4 Occupations, States and Territories - August 2024.xlsx; Total Employed - https://www.abs.gov.au/statistics/labour/employment-and-unemployment/labour-force-australia-detailed/latest-release#data-downloads > EQ08 - Employed persons by Occupation unit group of main job (ANZSCO), Sex, State and Territory, August 1986 onwards (Pivot Table). Refer to the ANZSCO Occupation Table below for the break-down of Nursing and Midwifery occupations covered in the scope of this report.
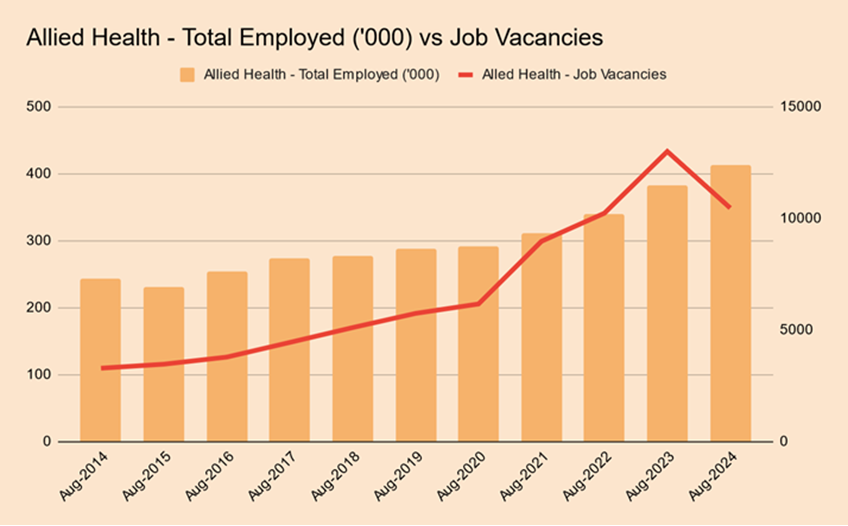
ALLIED HEALTH
Job Vacancies, Aug-24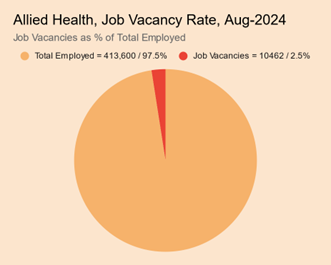
Month-on-month change (Aug-24 vs July-24): ⬇
-2 -0.02%
Year-on-year change (Aug-24 vs Aug-23): ⬇
-2534 -19.50%
Job Vacancy Rate, Aug-24
(vacancies as % of total employed workforce): 2.5%
10-year Trend: Total Employed vs Job Vacancies
Source: Job Vacancies - https://www.jobsandskills.gov.au/data/internet-vacancy-index > Data downloads > Internet Vacancies, ANZSCO4 Occupations, States and Territories - August 2024.xlsx; Total Employed - https://www.abs.gov.au/statistics/labour/employment-and-unemployment/labour-force-australia-detailed/latest-release#data-downloads > EQ08 - Employed persons by Occupation unit group of main job (ANZSCO), Sex, State and Territory, August 1986 onwards (Pivot Table). Refer to the ANZSCO Occupation Table below for the break-down of Allied Health occupations covered in the scope of this report.
SUPPORT WORKERS / ASSISTANTS / TECHNICIANS
Job Vacancies, Aug-24: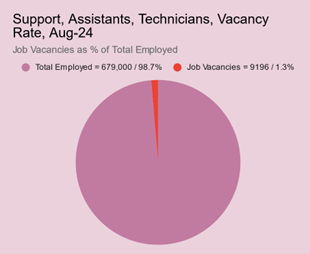
Month-on-month change (Aug-24 vs July-24): ⬇
-33 -5.86%
Year-on-year change (Aug-24 vs Aug-23): ⬇
-180 -25.40%
Job Vacancy Rate, Aug-24
(vacancies as % of total employed workforce): 1.3%
10-year Trend: Total Employed vs Job Vacancies
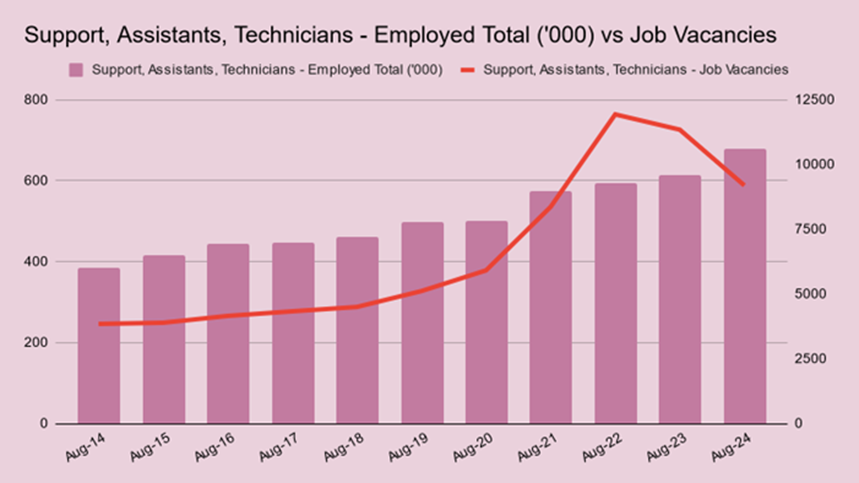
Source: Job Vacancies - https://www.jobsandskills.gov.au/data/internet-vacancy-index > Data downloads > Internet Vacancies, ANZSCO4 Occupations, States and Territories - August 2024.xlsx; Total Employed - https://www.abs.gov.au/statistics/labour/employment-and-unemployment/labour-force-australia-detailed/latest-release#data-downloads > EQ08 - Employed persons by Occupation unit group of main job (ANZSCO), Sex, State and Territory, August 1986 onwards (Pivot Table). Refer to the ANZSCO Occupation Table below for the break-down of Support Workers, Assistants and Technician occupations covered in the scope of this report.
In-demand Jobs this month: Health and Medical Occupations with the highest number of job vacancies in Australia, Aug-24:
- Registered Nurses: 7112*
- Aged and Disabled Carers: 3764
- General Practitioners and Resident Medical Officers: 3523*
- Occupational Therapists: 1802*
- Social workers: 1633*
- Nursing Support and Personal Care Workers: 1468*
- Welfare Support Workers: 1353*
- Physiotherapists: 1294*
- Audiologists and Speech Pathologists/Therapists: 1194*
- Occupational and Environmental Health Professionals: 1131*
*IVI Aug-24 - 3 month average - jobs advertised online
In-demand jobs this year: Health and Medical Occupations with the highest annual growth or lowest decline in job vacancies, Aug-23 vs Aug-24:
With record growth in employment numbers and a weakening economy, the Australian labour market has experienced a decline in job vacancy rates year-on-year. The list below, therefore, looks at the Health and Medical occupations experiencing the lowest decline in job ad volumes from Aug-23 to Aug-24.
- Surgeons: + 11.05%*
- Psychiatrists: -0.46%*
- Welfare Support Workers: -5.89%*
- Specialist Physicians: -6.47%*
- Dental Assistants: -9.70%*
- Social workers: -9.91%*
- Nutrition Professionals: -12.55%*
- Special Care Workers: -12.11%*
- Occupational and Environmental Health Professionals: -15.76%*
- Audiologists and Speech Pathologists/Therapists: -17.71%*
*IVI Aug-24 - 3 month average – jobs advertised online, Aug-24 vs Aug-23
ANZSCO Occupation Table - Health and Medical Occupations and Occupation Categories:

Table notes: Created by MedicalJobsAustralia.com, shows which occupations are covered in the scope of our report, and how occupations are grouped. Source: ANZSCO 4-digit occupations relevant to the Health and Medical workforce.


