Each quarter, Medical Jobs explores the latest available data from The Internet Vacancy Index (IVI) and the ABS Labour Force - providing an up-to-date snapshot of employment growth and demand in Australia’s health and medical labour market.
JOB VACANCY Summary (February 2025 data):
- Health sector job ads decline over the quarter and year - In February 2025, online job advertisements for health and medical occupations in Australia fell to 28,160—a decline of 6,500 (-18.7%) from the previous quarter (November 2024) and 8,096 (-22.33%) from the previous year (February 2024). This reflects a continued softening in demand and ongoing labour market adjustments - extending the downward trajectory of health sector job ads nationwide, since their peak of 44,318 in October 2023.
- Health sector job ads decline across AU States and Territories – All AU States and Territories saw fewer health sector job ads compared to the previous quarter and year. TAS had the largest year-on-year decline (-35.51%), while the NT had the smallest year-on-year decline (-3.09%). See Table 1 below.
- Firm demand continues in the Northern Territory with job ads for Nursing and Midwifery occupations increasing over the quarter, and higher numbers of job vacancies for Allied Health and Medical Practitioner roles compared to a year ago.
Table 1. Online Job Ads, Health and Medical Occupations, by Australian State and Territory, Feb 2025
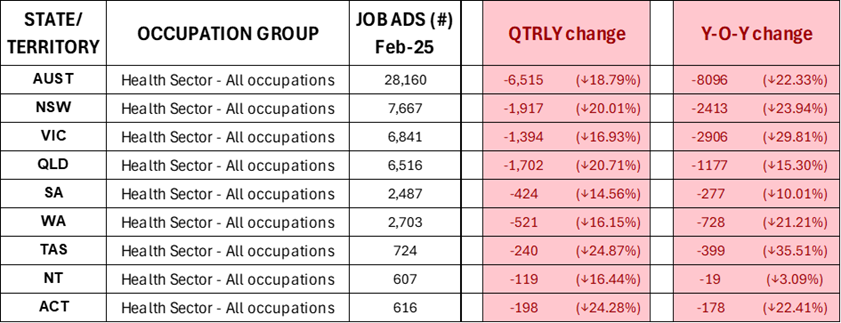
Table 1. notes: Source: https://www.jobsandskills.gov.au/data/internet-vacancy-index > Data downloads > Internet Vacancies, ANZSCO4 Occupations, States and Territories - February 2025.xlsx. ‘Health and Medical’ occupations only - refer to the ANZSCO Occupation table below for the full list covered in the scope of this report.
- Health sector job ads fall across occupation groups: In February 2025, job ads fell across occupation groups compared to the previous quarter and year. Nursing and Midwifery saw the largest year-on-year declines in job ads (-32.82%), with declines in TAS (-46.52%), VIC (-44.35%), and NSW (-38.80%) the most pronounced. Medical Practitioner job ads declined by -30.94% over the quarter, being the highest fall among occupation groups. However, there were only -7.86% fewer job ads for Medical Practitioners compared to 2 years ago (Feb-23) (see Chart 1 below), while NT saw slightly higher numbers year-on-year (+10, or +21.23%) – suggesting stable demand for Medical Practitioners over the longer term plus regional staff shortages. Job ads for Technicians / Assistants / Support roles saw the smallest quarterly and year-on-year declines across occupation groups, which suggests labour market conditions are stabilising somewhat for this workforce.
Table 2. Health Sector Job Ads, Australia, by Occupation Group, Feb 2025
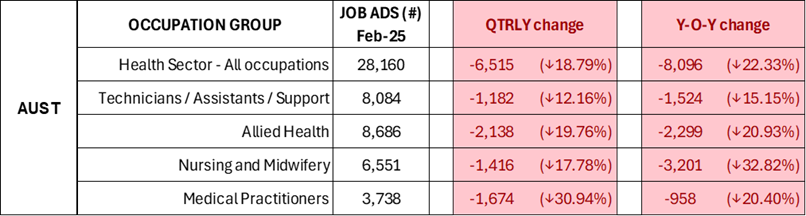
Table 2. notes: Source: https://www.jobsandskills.gov.au/data/internet-vacancy-index > Data downloads > Internet Vacancies, ANZSCO4 Occupations, States and Territories - February 2025.xlsx. For occupation groups - refer to the ANZSCO Occupation table below.
Chart. 1: Online Health Sector Job Ads, Australia, 2-yr trend by Occupation Group, Feb 2025
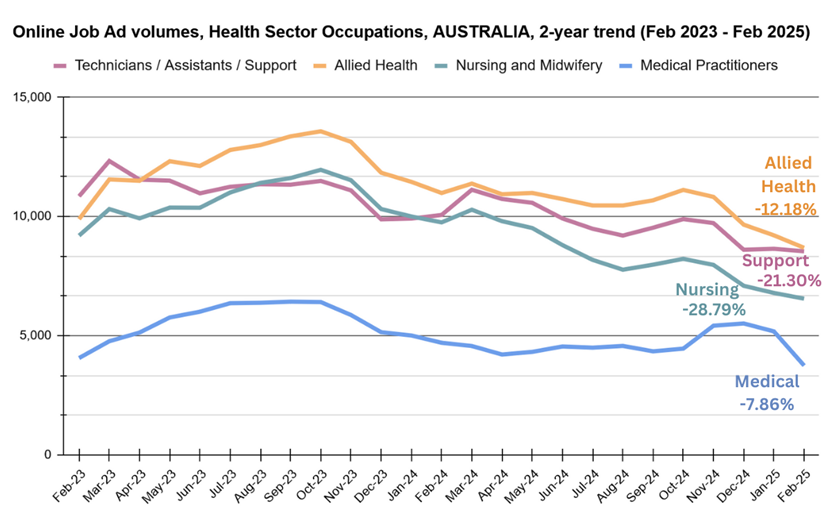
Source: https://www.jobsandskills.gov.au/data/internet-vacancy-index > Data downloads > Internet Vacancies, ANZSCO4 Occupations, States and Territories - February 2025.xlsx. *Refer to the ANZSCO Occupation Table below for the break-down of health sector Occupations and Occupation Groups covered in the scope of this report.
- Stable vacancy numbers continue for several health sector occupations over the quarter (i.e. no major declines, or slightly higher/steady job ad volumes). Strong quarterly increases in job ads were noted for Dental Assistants (+ 18.04%), Optometrists and Orthoptists (+ 12.57%), and Dental Hygienists, Technicians and Therapists (+ 5.56%). Longer term demand stability trends for individual occupations are analysed in the Occupations in Demand section below.
WORKFORCE GROWTH Summary (February 2025 data):
- Health Sector employment expands, remains steady after robust growth: the total number of people employed nationwide in Australian health sector occupations grew by 4% year-on-year. VIC, QLD, NT and NSW had positive year-on-year growth, while SA, WA and TAS had negative year-on-year growth. TAS was the only state with negative quarterly and year-on-year growth.
Table 3. Total Employed, Health and Medical Occupations, by AU State and Territory, Feb 2025
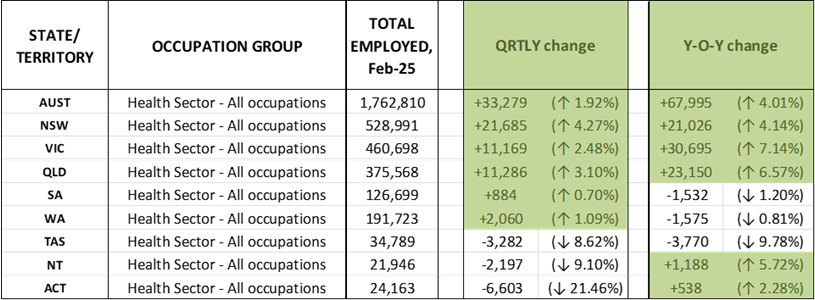
Table 3 notes: Source: https://www.abs.gov.au/statistics/labour/employment-and-unemployment/labour-force-australia-detailed/latest-release#data-downloads > EQ08 - Employed persons by Occupation unit group of main job (ANZSCO), Sex, State and Territory, August 1986 onwards (Pivot Table ). Feb-25 latest data. *Refer to the ANZSCO Occupation Table below for the health and medical occupations and occupation groups covered in this report.
- Workforces expand across most occupation groups nationwide, but some groups recorded quarterly and year-on-year contractions: Compared to 2 years ago, the total employed nationwide has increased across all occupation groups, see Chart 2 below. However, year-on-year, the total employed nationwide in Nursing and Midwifery occupations has reduced, with fewer Nurses and Midwives employed in NSW, QLD, SA, TAS, NT and ACT compared to the same time a year ago.
- Workforce growth varies by Occupation group and AU State and Territory: TAS experienced year-on-year contractions across all occupation groups. WA and NSW have fewer Medical Practitioners employed year-on-year, ACT has fewer employed in Allied Health occupations year-on-year, and there are fewer people employed in Technician / Assistant / Support roles in WA and SA, year-on-year. This suggests that while health sector employment is still expanding overall, there are regional and occupational variations where employment levels are adjusting post pandemic.
Table 4. Health Sector Total Employed, Australia, by Occupation Group, Feb 2025
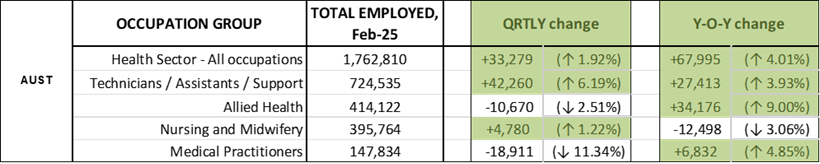
Table 3. notes: Source:https://www.abs.gov.au/statistics/labour/employment-and-unemployment/labour-force-australia-detailed/latest-release#data-downloads > EQ08 - Employed persons by Occupation unit group of main job (ANZSCO), Sex, State and Territory, August 1986 onwards (Pivot Table), Feb-25 latest data. *Refer to the ANZSCO Occupation Table below for the health and medical occupations and occupation groups covered in this report.
Chart 2. Total Employed, Health and Medical Occupations, 10-yr trend (Feb 2015 – Feb 2025) and 2-yr % change
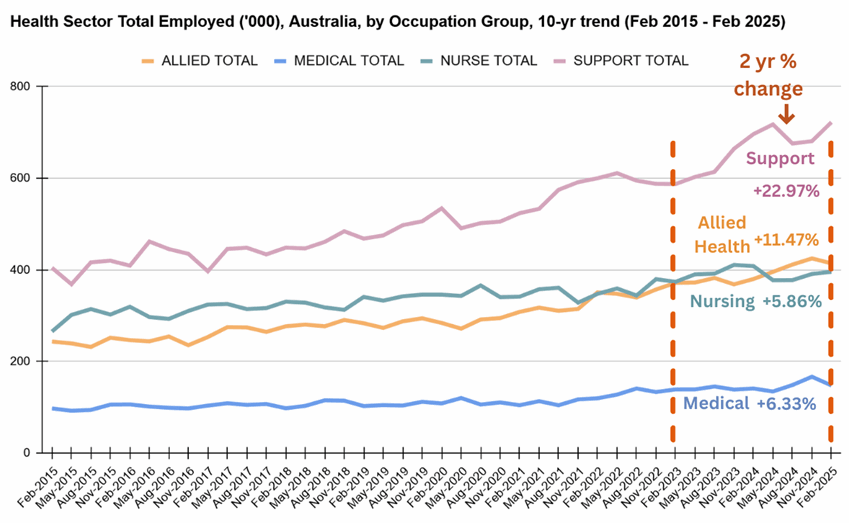
Source: https://www.abs.gov.au/statistics/labour/employment-and-unemployment/labour-force-australia-detailed/latest-release#data-downloads > EQ08 - Employed persons by Occupation unit group of main job (ANZSCO), Sex, State and Territory, August 1986 onwards (Pivot Table), Feb-25 latest data. *Refer to the ANZSCO Occupation Table below for the health and medical occupations and occupation groups covered in this report.
Chart 3. Australian Health Sector Occupations: Vacancies vs Total Employed vs Population: 10-year trend, (Feb 2015 – Feb 2025)
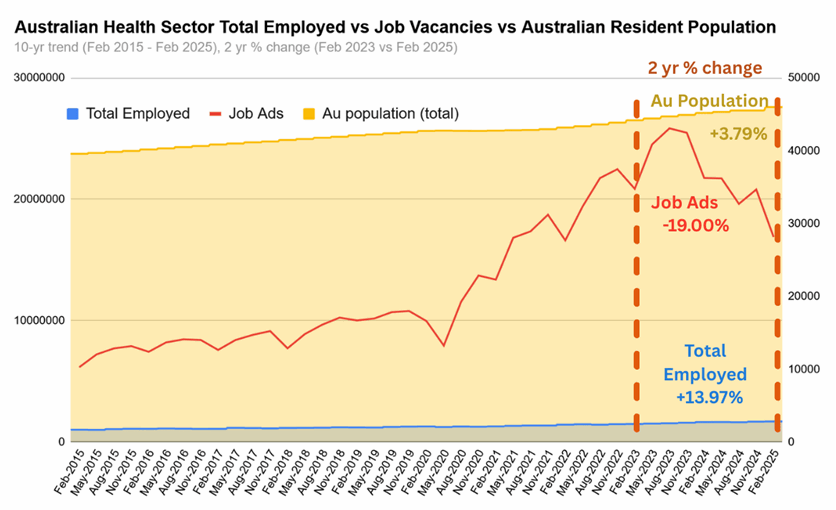
Source: https://www.abs.gov.au/statistics/labour/employment-and-unemployment/labour-force-australia-detailed/latest-release#data-downloads > EQ08 - Employed persons by Occupation unit group of main job (ANZSCO), Sex, State and Territory, August 1986 onwards (Pivot Table), Feb-25 latest data; https://www.jobsandskills.gov.au/data/internet-vacancy-index > Data downloads > Internet Vacancies, ANZSCO4 Occupations, States and Territories - February 2025.xlsx; ABS Quarterly Population Estimates (ERP), by State/Territory, Sex and Age
IN DEMAND/GROWTH OCCUPATIONS, February 2025:
Australian health and medical occupations with a firm demand rating* in February 2025 include:
- Audiologists and Speech Pathologists/Therapists
- Anaesthetists
- General Practitioners and Resident Medical Officers
- Psychiatrists
- Specialist Physicians
- Psychologists
- Dental Practitioners
- Welfare Support Workers
- Social Workers
- Other Medical Practitioners
- Nursing Support and Personal Care Workers
- Podiatrists
- Medical Imaging Professionals
- Occupational and Environmental Health Professionals
- Surgeons
*a firm demand rating refers to occupations with higher employment numbers and vacancies in Feb 2025 compared to Feb 2022 (pre-peak) and Feb 2019 (pre-pandemic).
Final Comments:
Job ads and vacancies for health and medical occupations in Australia continue to drop since peaking in October 2023 following significant hiring demand during the latter years of the pandemic. This contraction in demand, however, contrasts with firm employment gains in the sector - a larger pool of people employed and an expanding workforce. While labour market conditions are easing somewhat, demand persists for skilled professionals and specific health and social occupations, particularly in regional areas, where workforce supply challenges and heightened consumer demand for health services are most evident.
ANZSCO Occupation Table:
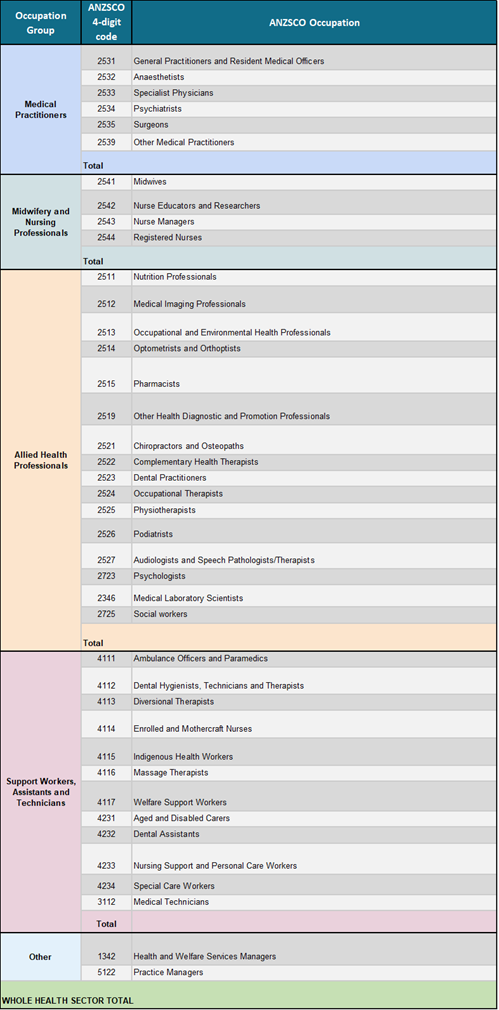
Below is our breakdown of the 4-digit ANZSCO Health and Medical Occupations, and Occupation Groups, covered in the scope of this report.