

Our analysis examines health sector employment numbers and job vacancy rates by Australian states and territories. We analyse employment distribution and 5-year trends for each state/territory compared to the national average. Additionally, we compare growth rates in job vacancies for each state and territory across three broad occupation groups (ANSCO2) - Medical Practitioners and Nurses; Health Diagnostic and Therapy Professionals; and Health and Welfare Support Workers.
Summary:
Employment in the Healthcare and Social Assistance Industry continues to grow nationally at a strong pace, trying to keep up with service demand and population growth. Employment distribution by state is shown in Figure 1 below, with NSW having the largest share of employment (30% of the industry total).
Figure 1. Health Care and Social Assistance Industry – Total Employed > Distribution by Australian State and Territory, Nov-23
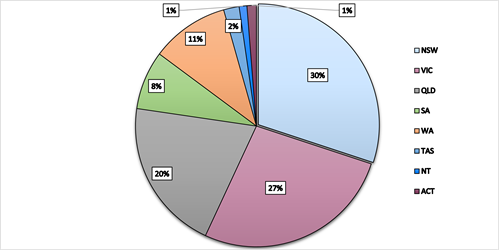
Figure 1. Generated by MedicalJobsAustralia.com using data from source: Labour Force, Australia, Detailed – Jan 2024 > Table 05. Employed persons by State, Territory and Industry division of main job (ANZSIC) > Nov-23
5-year trends, in Figure 2 below, reveal that post-November 2021, employment growth in the Healthcare and Social Assistance Industry has dropped below the national average for NSW and SA. VIC, QLD, and TAS are aligning more or less with the national average, while ACT and NT have dropped below the national average since August 2023.
Figure 2. Health Care and Social Assistance Industry – Total Employed, by Australian State vs National Average, 5-Year Trend
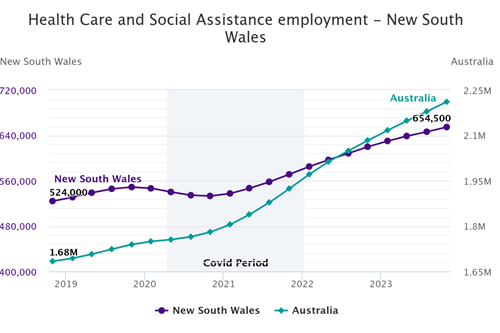
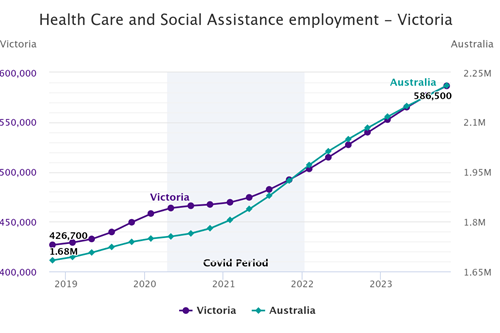
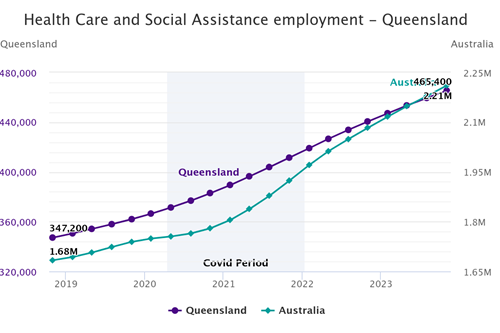
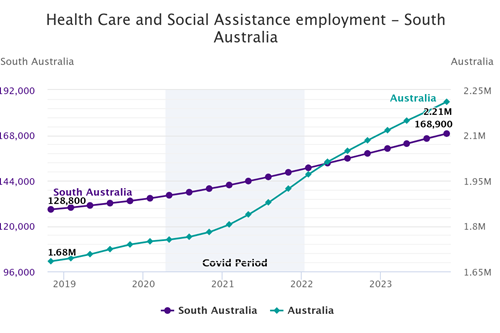
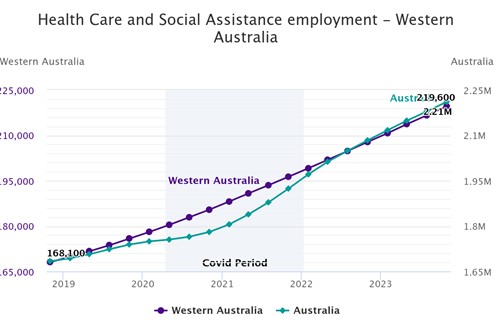
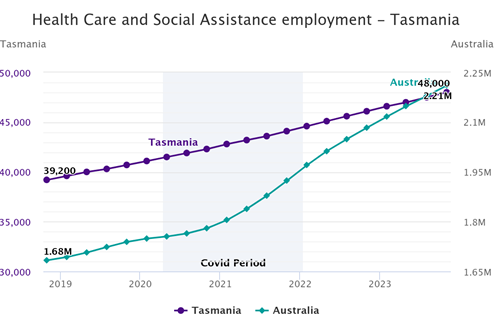
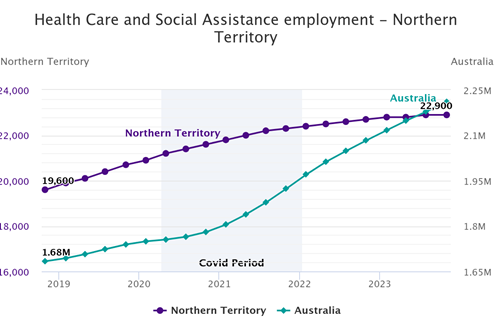
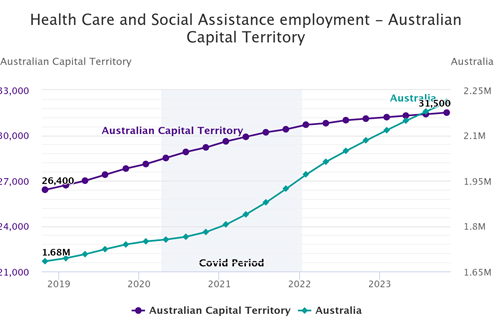
Figure 2. Reprinted from: Jobs and Skills Australia Atlas Dashboard> Healthcare and Social Assistance Industry> filtered by each State; (Original source: ABS, Detailed Labour Force Survey (Table EQ06), November 2023, Data trended by Jobs and Skills Australia). *Estimates are often based on small sample counts and can be quite volatile. **COVID period values (May 2020 - Nov 2021) have been censored due to large quarterly fluctuations in employment.
Table 1 below shows job vacancy growth was mixed across occupational groups and states/territories. Australia-wide, job vacancies for Health and Welfare Support Workers showed the biggest declines, down -8% year-on-year (Jan-23 vs Jan-24), while job ads for Medical Practitioners and Nurses, and Health Diagnostic and Therapy professionals, grew by over 10%, demonstrating continued strong demand for health professionals.
The largest year-on-year declines were for Health and Welfare Support Workers in VIC and QLD.
The highest year-on-year increases were for Health Diagnostic and Therapy Professionals in TAS, and for Medical Practitioners and Nurses in SA. Both TAS and SA recorded steady growth in job ads across all occupation groups.
Table 1. Health Sector Job Ad growth by Occupation group (ANZSCO2) and by Australian State/Territory - Jan 2024
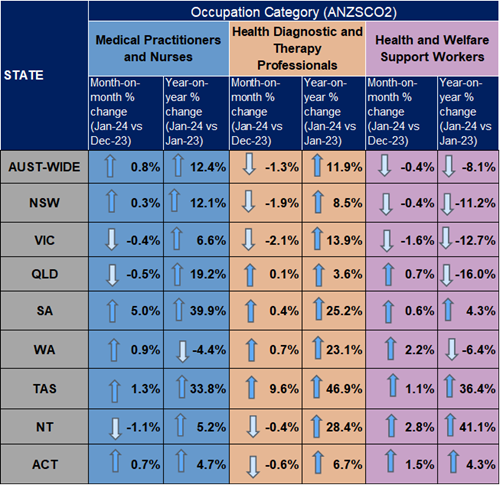
Table 1. Source: IVI Jan 2024 > Data downloads: Internet Vacancies, ANZSCO2 Occupations, States and Territories - January 2024 > Trend tab


