

MedicalJobsAustralia.com’s Health Workforce Update-March 2024 brings you the latest health and medical job vacancy statistics and workforce trends in Australia.
Australian Job Vacancy Summary:
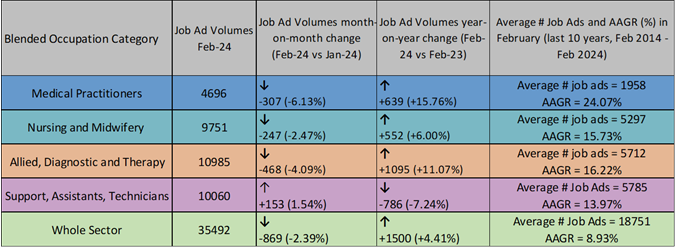
The latest Internet Vacancy Index (IVI) by Jobs and Skills Australia recorded month-on-month declines in health and medical job ads (January-24 vs February-24), with falls across all occupation groups except the Support Workers, Assistants and Technicians category.
Year-on-year growth, on the other hand, remains positive for all occupation groups except Support Workers, Assistants and Technicians, which have declined year-on-year by 7.24%, so it is welcome news that jobs ads increased this month for this occupation group.
While labour force demand in the sector remains resilient in the face of rising national unemployment, the latest year-on-year growth in job vacancies is lower than the 10-year annual average growth rate, suggesting vacancy rates are starting to stabilise since the post-pandemic peak. The current number of job ads this month, across all occupation categories, remains much higher than the 10-year average - demonstrating continued workforce demand alongside the expanding population and consumer demand for health services.
Table 1. IVI Job Ad Volumes, Feb 2024: Month-on-month and year-on-year changes across occupation groups in Australia
Notes Table 1: Generated by MedicaljobsAustralia.com using data from the Internet Vacancy Index Report > Data downloads: Internet Vacancies, ANZSCO4 Occupations, States and Territories - February 2024. *More information on our occupation categories can be in Table. 2 ‘ANZSCO4 Occupation Guide’ below.
Table 2. ANZSCO 4-Digit Occupation Guide:
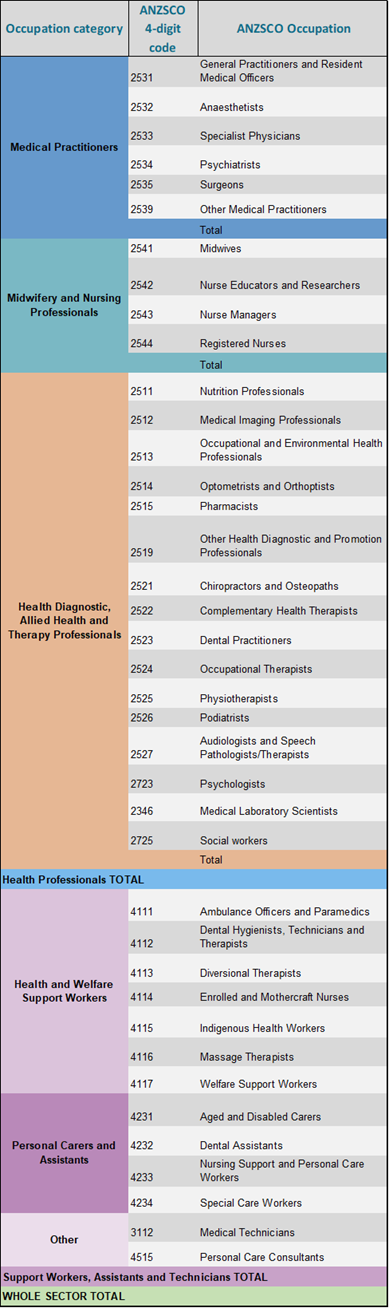
Notes Table 2: Generated by MedicalJobsAustralia.com using the Internet Vacancy Index (IVI) and ANZSCO 4-digit occupations relevant to the Health and Medical workforce.
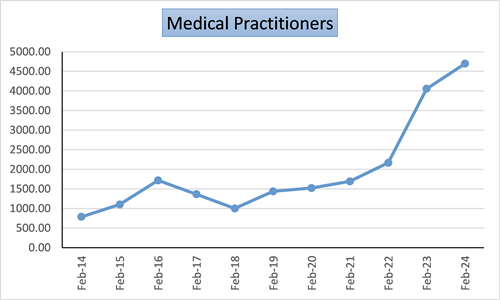
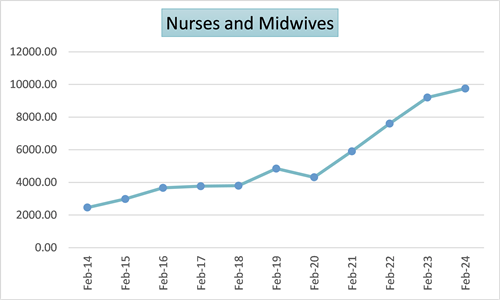
Medical Practitioner job ads fell 6.13% over the month but remain 15.76% higher year-on-year (February-24 vs February-23). Figure 1. below shows the long-term trend in job vacancy growth since February 2014 for Medical Practitioners, and Nurses and Midwives.
Figure 1. IVI: Australian Job Ads – Long-term (10 year) trend
Notes Figure 1: Generated by MedicaljobsAustralia.com using data from the Internet Vacancy Index Report/latest release > Data downloads: Internet Vacancies, ANZSCO4 Occupations, States and Territories - February 2024. *More information on our occupation categories can be found in Table. 2 ‘ANZSCO4 Occupation Guide’ above.
The annual growth rate in job ads has slowed since May 2023. Job vacancy volumes have been declining for most health and medical occupation groups since Oct 2023, except Support Workers, Assistants and Technicians, which have recorded a slight uptick in job ads in January24 and February24.
Figure 2. IVI Australian Job Ad Volumes year-on-year: Feb-23 to Feb-24
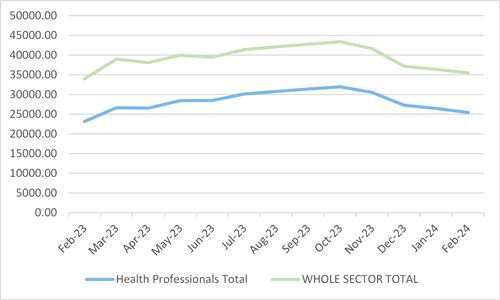
Notes Figure 2: Generated by MedicaljobsAustralia.com using data from the Internet Vacancy Index > Data downloads: Internet Vacancies, ANZSCO4 Occupations, States and Territories - February 2024.
- Health Professionals Total > combines the following occupation groups: Medical Practitioners; Nurses and Midwives; and Allied Health, Diagnostic and Therapy Professionals.
- WHOLE SECTOR TOTAL > combines the Health Professionals Total (above) plus the following occupation groups: Health and Welfare Support Workers, Personal Carers, Technicians and Assistants.
More information on our occupation categories can be in Table. 2 ‘ANZSCO4 Occupation Guide’ above.
The current distribution of the health and medical workforce is shown in Figure 3. below, with Support Workers, Assistants and Technicians making up the majority of the workforce, followed by Allied Health, Diagnostic and Therapy Professionals.
Figure 3. Current distribution of the health and medical workforce in Australia
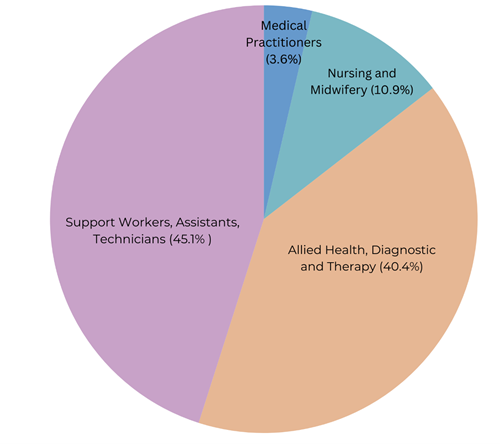
Notes Figure 3: Generated by MedicaljobsAustralia.com using data from https://www.abs.gov.au/statistics/labour/employment-and-unemployment/labour-force-australia-detailed/latest-release > Data downloads: EQ08 - Employed persons by Occupation unit group of main job (ANZSCO), Sex, State and Territory, August 1986 onwards (Pivot Table). Data reference period: November Qtr. 2023. *Occupation groups consist of multiple ANZSCO 4-digit occupations. These are listed in Table 2. ANZSCO4 Occupation Guide, above.
Current health and medical job vacancies make up 0.93% of the total employed in the industry. Job vacancies as a percentage of the current workforce are calculated below in Figure 4, for each occupation category. Medical Practitioners have the highest vacancy rates.
Figure 4. IVI job vacancies in Australia (February 2024), as % of the workforce
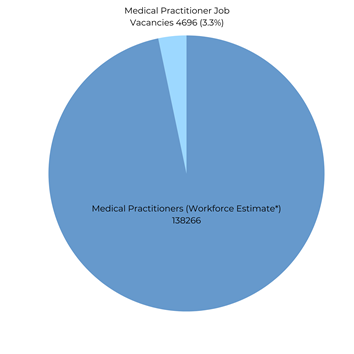
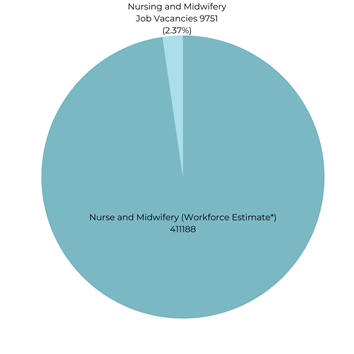
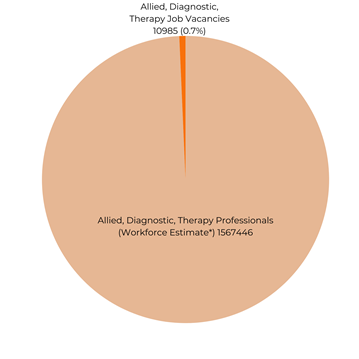
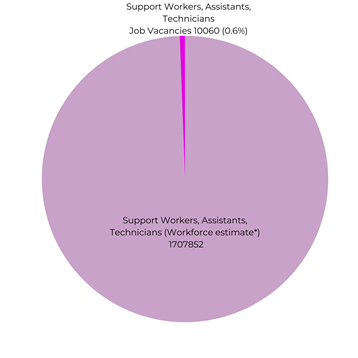
Notes Figure 4: Generated by MedicaljobsAustralia.com using data from source: the Internet Vacancy Index > Data downloads: Internet Vacancies, ANZSCO4 Occupations, States and Territories - February 2024.
*Workforce estimate is calculated using https://www.abs.gov.au/statistics/labour/employment-and-unemployment/labour-force-australia-detailed/latest-release > Data downloads: EQ08 - Employed persons by Occupation unit group of main job (ANZSCO), Sex, State and Territory, August 1986 onwards (Pivot Table> Data reference period: November Qtr. 2023. Occupation groups consist of multiple ANZSCO 4-digit occupations. These are listed above in Table 2. ANZSCO4 Occupation Guide.
Health and medical jobs-in-demand: Occupations with the highest number of vacancies in Australia (IVI February 2024 - ANZSCO4 Occupations):
- Registered Nurses – 8,940 jobs advertised.
- General Practitioners and Resident Medical Officers – 3,582 jobs advertised.
- Aged and Disabled Carers – 3,858 jobs advertised.
- Occupational Therapists – 1,904 jobs advertised.
- Nursing Support and Personal Care Workers – 1,789 jobs advertised.
- Physiotherapists – 1,469 jobs advertised.


