

This report looks at the latest statistics from ABS Job Vacancies, Australia (reference period November 2023, released quarterly) and ABS Labour Account Australia (reference period September 2023, released quarterly and annually), focusing on data and trends relevant to the medical and health care sector.
The proportion of businesses reporting vacancies in the Health Care and Social Assistance Industry has been trending downwards since February 2023.
Chart. 1 Proportion (%) of Businesses reporting Vacancies, Health Care and Social Assistance Industry, quarterly changes.
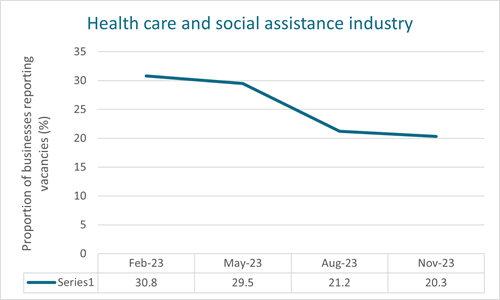
Chart 1. created by MedicalJobsAustralia.com using https://www.abs.gov.au/statistics/labour/jobs/job-vacancies-australia/nov-2023 > Proportion of businesses reporting vacancies, industry (%) > Health care and social assistance
The proportion of businesses reporting vacancies is still higher than a year ago (November 2022 vs November 2023), but lower than in November 2021. (Note: This ABS metric started in 2020, so we are unable to make comparisons to pre-pandemic years).
Chart 2. Proportion (%) of Businesses reporting Vacancies, Health Care and Social Assistance Industry, year-on-year changes.
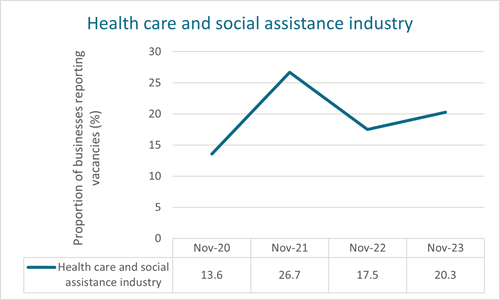
Chart 2. created by MedicalJobsAustralia.com using Job Vacancies, Australia, November 2023, Job Vacancies, Australia, November 2022, Job Vacancies, Australia, November 2021 > Proportion of businesses reporting vacancies, industry (%) > Health care and social assistance.
Job Vacancies in the Healthcare and Social Assistance industry are still elevated compared to pre-pandemic years, but the rate of growth is stabilising.
Chart 3. Job Vacancies (‘000), Health Care and Social Assistance Industry, 8-year trend
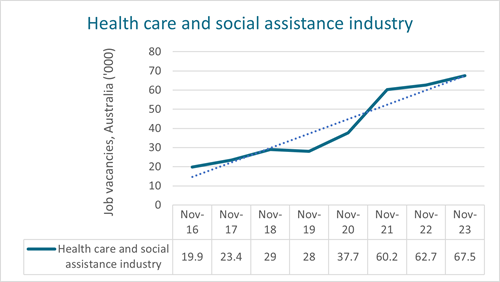
Chart 3. created by MedicalJobsAustralia.com using Job Vacancies, Australia, November 2023, Job Vacancies, Australia, November 2022, Job Vacancies, Australia, November 2021, Job Vacancies, Australia, November 2020, Job Vacancies, Australia, November 2019, Job Vacancies, Australia Nov 2018, Job Vacancies, Australia Nov 2017 > Job vacancies ('000), industry> Health care and social assistance.
The June -September 2023 quarter saw ≈ 2% increases in Total Jobs, Filled Jobs and Employed People in the Health Care and Social Assistance Industry, demonstrating strong growth continues for the sector and workforce. Filled Jobs grew more in the private sector (2.0%) than in the public sector (0.8%). Hours worked per job remained steady.
Table 1. Labour Account Australia, September 2023: Total Jobs, Filled Jobs, Employed People, Hours Worked per Job > Health care and social assistance industry
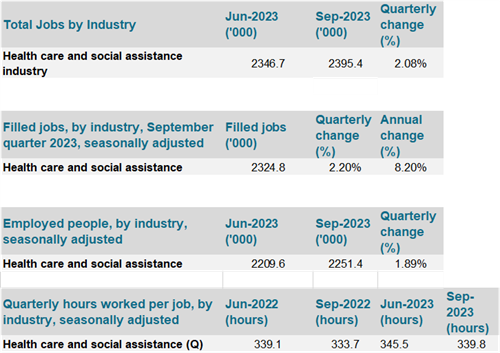
Table 1. Source: https://www.abs.gov.au/statistics/labour/labour-accounts/labour-account-australia/sep-2023
The Health Care and Social Assistance Industry - more information about the Australian and New Zealand Standard Industrial Classification (ANZSIC) can be found here.


